


By Bhas Nalabothula, Managing Director, Head of U.S. Institutional Rates, Tradeweb
Data Analysis by: Sean Hu, Director, Head of U.S. Institutional Rates Data Sciences, Mihir Chinai, Steve Qiu and Neha Nayak, U.S. Institutional Rates Data Analysts, Chelcy Fernandes, Vice President, Data Product Management, Jonathan Rick, Director, Data Product Management

Bhas Nalabothula, Tradeweb
While big stock market milestones like the S&P 500 heading toward its worst drop since COVID are grabbing the headlines right now, the real metric institutional investors are watching most closely is liquidity. Stocks will always rise and fall; if liquidity dries up, then we’ll have a real problem. So far, according to the data, market liquidity has remained strong in response to the sweeping changes affecting global trade policy in the U.S., but it has not been immune from some volatile moves.
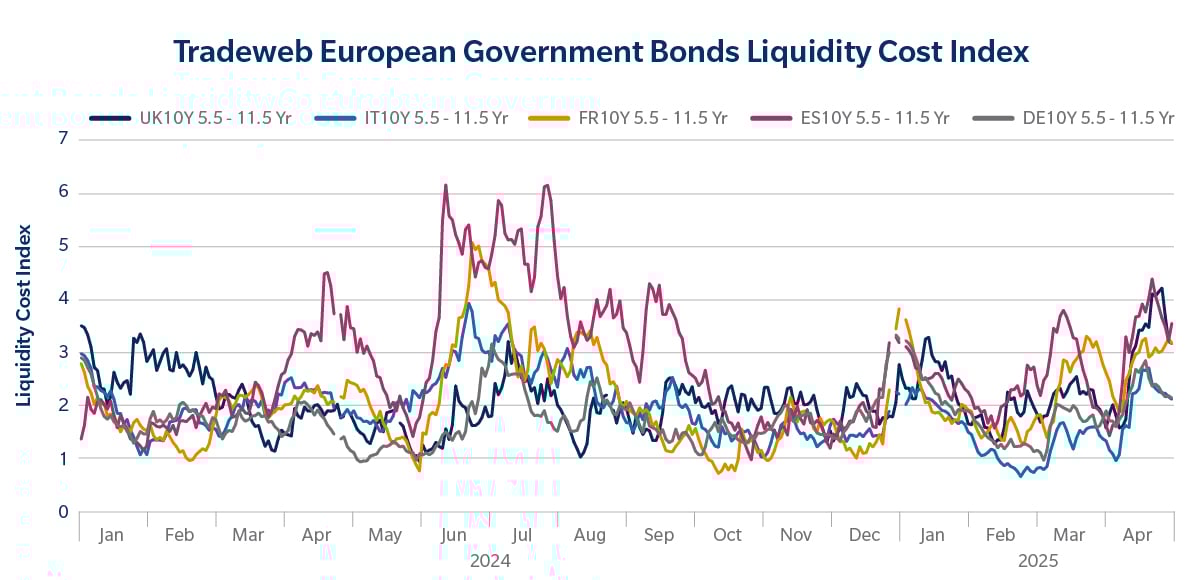
Let’s look at the play-by-play. On April 2, 2025, the U.S. federal administration unveiled a set of tariffs on all imports into the United States, and even higher tariffs on goods from about 60 countries or trading blocs that have a high trade deficit with the U.S. While markets had been bracing for tariff action, the scale and scope of the announcement caught many off guard. The equity markets reacted sharply, with the S&P 500 dropping 20% from recent highs. The U.S. rates market saw a move of similar magnitude, with 10-year Treasury yields selling off 49 basis points (bps) between April 4 to 11. We saw these historic moves play out across our platform, as well. On April 9, Tradeweb facilitated single-day volume of $472.5 billion in U.S. government bonds. These records coincided with a period of elevated market volatility and heightened investor engagement on our institutional and wholesale electronic trading platforms. European government bond markets also experienced sharp bouts of volatility in April. However, the rise in liquidity costs was much more subdued compared to the U.S., and didn’t reach the heights of the French election crisis back in the summer of 2024. In contrast, UK Gilt markets seemed to be more aligned with their U.S. Treasury counterparts and saw more pronounced spikes last month.
In times like these, market participants are often reminded of the old adage: “Buy the rumor, sell the fact.” Often, anticipated prices are priced-in well before they are formally enacted. Yet despite this tried-and-true wisdom, in the days following the tariff announcements, we saw market liquidity worsen across asset classes—from equities to rates to credit. For institutional investors and dealers alike, this raises fundamental questions: Are we still able to clear risk effectively? How much more expensive have transactions become? And perhaps most importantly—how much worse could conditions get?
Gauging the Impact: How Does April 2025 Compare to March 2020?
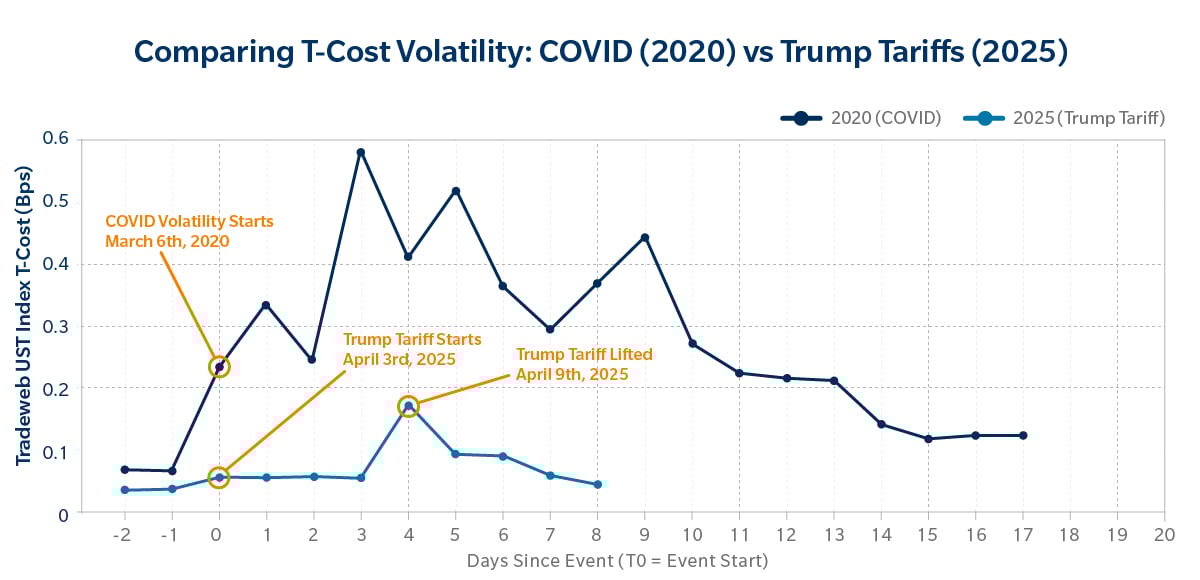
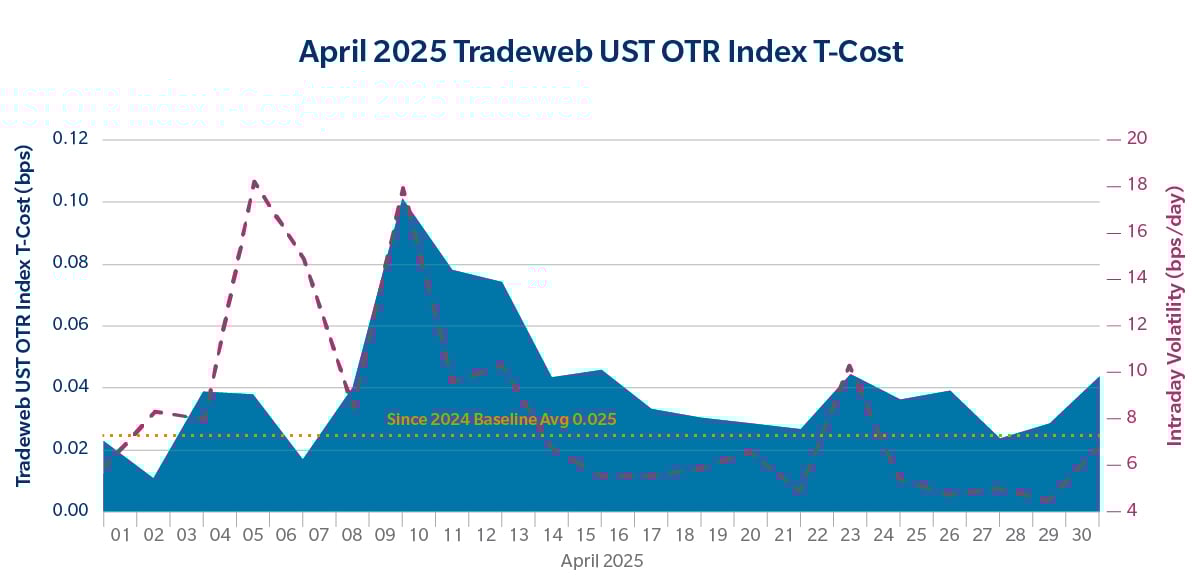
A frequent reference point in assessing liquidity stress is March 2020, when the onset of the COVID-19 pandemic sent shockwaves through global financial markets. To more accurately quantify the comparison between the two time periods, we turned to Tradeweb’s U.S. Treasury On-the-Run T-Cost Index—a transaction cost proxy that captures real-time shifts in market liquidity.
As illustrated in the first chart below, by tracking the change in the Tradeweb T-Cost index from March 2020 (blue line) versus that of April 2025 (light blue line), the tariff-related effects on liquidity have been significantly less dramatic. In March 2020, the index surged roughly 20x, climbing from 0.05bps to 0.58bps at its peak on March 8. In contrast, April 2025 had a much more moderate uptick, with the index moving from 0.03bps to 0.17bps at its highest point. While spreads have certainly widened, the liquidity crunch we saw in April 2025 has only been a fraction of what we witnessed in 2020.
(Tradeweb UST OTR T-Cost Index is a blend of realized T-Cost from the most frequently traded On-The-Run USTs.)[1]
*Data with grouped date ranges, all calculations are duration weighted avg. from TW Composite Mid.
Looking Ahead: How Much Worse Can This Get?
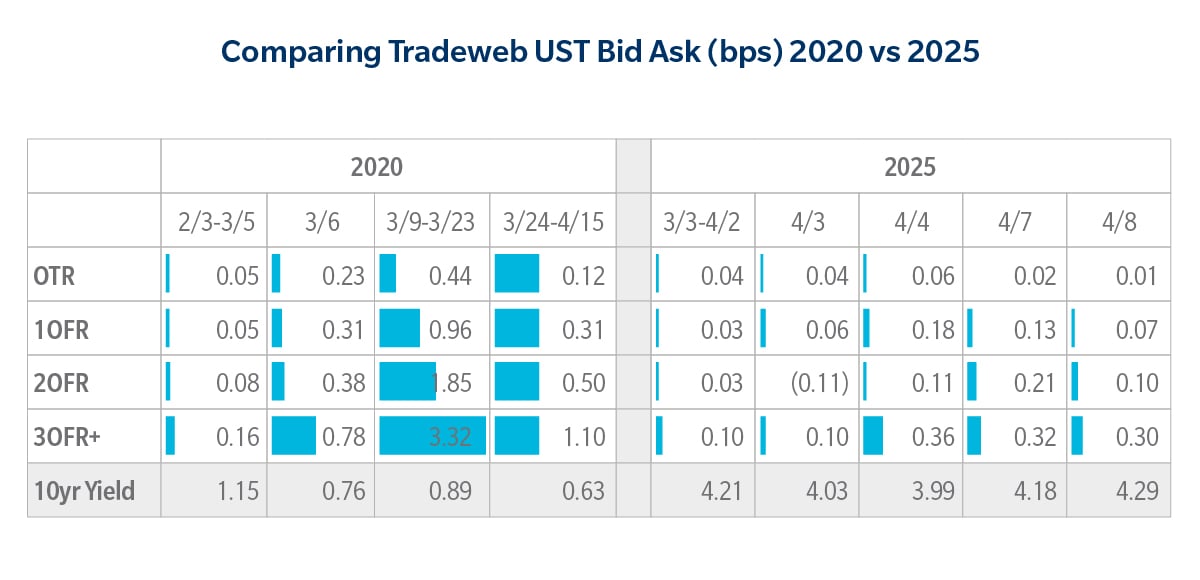
While some uncertainty remains around the final tariff policy implementation details, including possible exemptions and delayed enforcements, many market participants are cautiously optimistic that the most volatile period may now be behind us. The return of tighter bid/ask spreads following the peak on April 9 suggests a gradual normalization of liquidity.
The chart below shows the highest peak of T-Cost on April 9, and the subsequent steady return of liquidity over the following days.
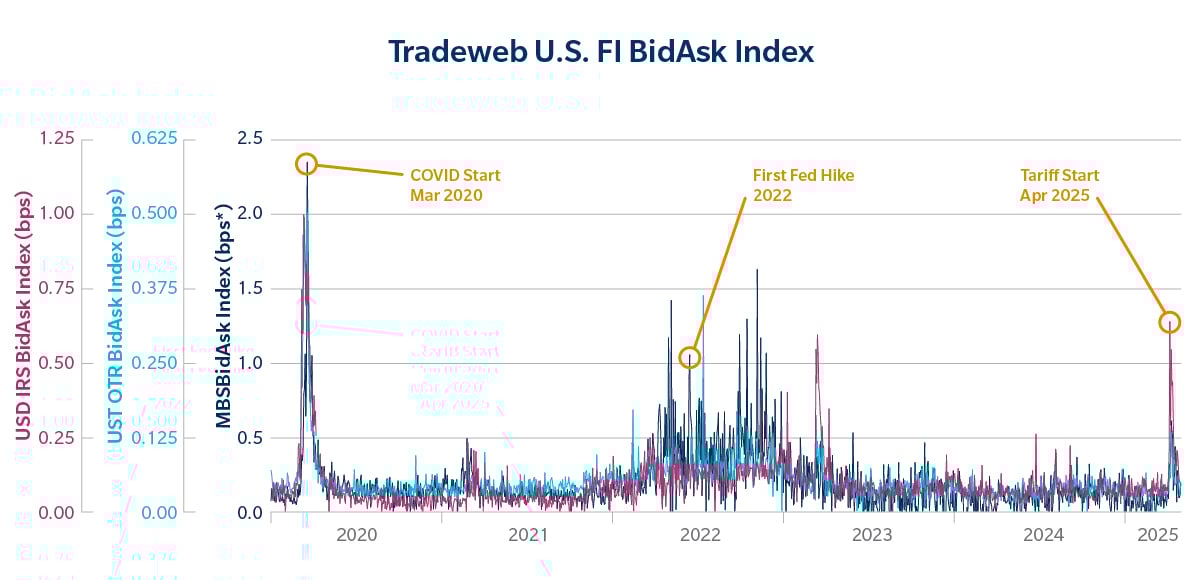
*Tradeweb U.S. FI BidAsk Index chart[2]
Moreover, with growing speculation around potential Fed intervention should conditions deteriorate further, there appears to be an implicit reassurance forming in the rates market. That said, continued monitoring of this space remains essential. As liquidity providers and institutional investors navigate the changing market ecosystem, short-term volatility is likely to persist. It will be critical for market participants to continue to track liquidity metrics closely as we continue through this period of heightened volatility and, in some cases, unpredictable swings in global trade policy. Beyond the transaction cost analysis outlined here, we are also closely watching the recent trend toward tightening of swaps spreads, which suggests that the markets continue to have confidence in U.S. Treasuries, as well as trends in mortgage-backed securities trading, which can signal underlying risk building in the economy. So far, all these indicators have clearly flashed caution signals in response to the burgeoning trade war, but we have not seen threats to liquidity at a level consistent with previous economic crises.
[1] Methodology: To gauge liquidity, we built a model “T-Cost” research index from Tradeweb on-the-run U.S. Treasury trades.
[2] BidAsk is defined as (traded yield – mid yield). Index weightings take rolling 1-year trade distribution amongst traded benchmarks. Indices under development. Please contact RatesData@tradeweb.com for any questions. MBS T-cost normalized from 32nds to bps using 55% average hedge ratio to T10 (~ T-Cost in 32nds / 1.5)
Source: Tradeweb

NEWSLETTER SIGN UP
And receive exclusive articles on securities markets
🏆 The 2026 Global Markets Choice Awards are here! 🌍 Nominations are officially OPEN for the celebration of excellence in global capital markets trading & technology. Nominate below:
https://www.jotform.com/form/260086385121150
Delaware Life Insurance Company is becoming the first insurance carrier to offer an index that contains cryptocurrency, adding the BlackRock U.S. Equity Bitcoin Balanced Risk 12% Index to its fixed index annuity (FIA) portfolio.
As the digital assets industry pushes toward
Franklin Templeton is expanding its tokenized fund suite, signaling growing institutional demand for blockchain-based fund infrastructure and regulated investment products moving onchain. Read the full article below:
$50 billion in active ETF inflows helped fuel a record year for @BlackRock 's iShares business, as investors continue to lean into active strategies.
Related articles
-

HSBC and LSEG have signed an MoU to develop connectivity to support investor access.
-

This deepens the integration of Chinese assets into the international financial infrastructure.
-

Clients will be able to access primary markets through partners.
-

This is the most significant update to Climate Bonds' taxonomy in years.