


ETFGI, reported that assets invested in the ETFs Industry in the United States reached US$15.7 Trillion milestone, driven by record US$837 billion in YTD net inflows.
During May, the ETFs industry in the United States gathered net inflows of US$189.01 billion, bringing year-to-date net inflows to US$837.35 billion, according to ETFGI’s May 2026 US ETFs industry landscape insights report, the monthly report which is part of an annual paid-for research subscription service. ETFGI, is a 14 year old leading independent research and consultancy firm renowned for its expertise in subscription research, consulting services, 6 annual ETFGI Global ETFs Insights Summits, and ETF TV on global ETF industry trends. (All dollar values in USD unless otherwise noted.)
Highlights
- Assets invested in the ETFs industry in the US reached a new record of $15.69 trillion at the end of May, surpassing the previous high of $14.87 trillion in April 2026.
- Assets have increased 16.8% year-to-date, rising from $13.43 trillion at the end of 2025.
- The industry gathered $189.01 billion of net inflows in May.
- Year-to-date net inflows of $837.35 billion mark a new record, exceeding $443.32 billion in 2025 and $399.10 billion in 2021.
- The ETF industry in the US has now recorded 49 consecutive months of net inflows.
“The S&P 500 rose 5.26% in May and is up 11.27% year‑to‑date in 2026. Developed markets excluding the U.S. gained 5.20% during May and are up 15.33% year‑to‑date, with Korea (+28.71%) and Luxembourg (+20.50%) delivering the strongest returns among developed markets for the month. Emerging markets increased by 3.77% in May and are up 11.44% year‑to‑date, led by Taiwan (+16.95%) and Peru (+11.75%), which recorded the highest gains among emerging markets in May.” According to Deborah Fuhr, Managing Partner and founder of ETFGI.
Growth in assets in the ETFs industry in the United States as of the end of May
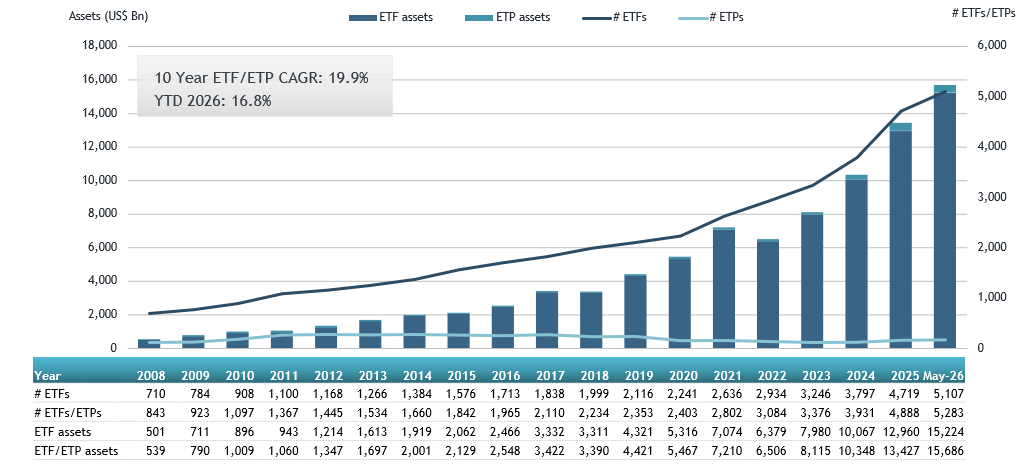
Source: ETFGI data sourced from ETF/ETP sponsors, exchanges, regulatory filings, Thomson Reuters/Lipper, Bloomberg, publicly available sources and data generated in-house. Note: “ETFs” are typically open-end index funds that provide daily portfolio transparency, are listed and traded on exchanges like stocks on a secondary basis as well as utilising a unique creation and redemption process for primary transactions. “ETPs” refers to other products that have similarities to ETFs in the way they trade and settle but they do not use a mutual fund structure. The use of other structures including grantor trusts, partnerships, notes and depositary receipts by ETPs can create different tax and regulatory implications for investors when compared to ETFs which are funds.
The ETFs industry in the United States has 5,283 ETFs, assets of $15.69 Tn, from 488 providers on 3 exchanges at the end of May.
The ETFs industry in the US continues to be highly concentrated competitive, with iShares and Vanguard effectively tied for leadership by assets, holding 28.9% and 28.6% market share respectively, while State Street SPDR remains third with 13.2%. Although iShares has the largest number of ETFs at 487, Vanguard has achieved nearly the same asset base with just 115 products, underscoring the strength of Vanguard’s scale and product concentration. State Street SPDR, with 179 products, maintains a significant position.
From a net flows perspective, Vanguard stands out as the strongest gatherer of net new assets, attracting $54.4 billion in May 2026 and $233.8 billion year-to-date, both ahead of iShares at $34.3 billion in May and $155.9 billion YTD. State Street SPDR remains a major player in trading activity, with $59.8 billion in average daily volume, net inflows have been more modest at $10.7 billion in May and $54.3 billion YTD.
Net Inflows
The industry gathered $189.01 billion of net inflows in May.
Year-to-date net inflows of $837.35 billion mark a new record, exceeding $443.32 billion in 2025 and $399.10 billion in 2021.
Equity ETFs attracted $78.62 billion over the month, bringing year-to-date net inflows to $378.22 billion, significantly higher than the $148.51 billion recorded at this point in 2025.
Fixed income ETFs recorded $41.50 billion of net inflows in May, with YTD inflows reaching $151.55 billion, well above the $93.67 billion gathered by the end of May 2025.
Commodity ETFs saw modest net inflows of $147.9 million in May, but remain in net outflow territory year-to-date at $2.99 billion, compared to $14.18 billion of net inflows at the same stage in 2025.
Active ETFs continued to attract strong demand, with $75.95 billion of net inflows in May, bringing YTD inflows to $329.09 billion, significantly exceeding the $177.01 billion recorded over the same period in 2025.
Substantial inflows can be attributed to the top 20 ETF’s by net new assets, which collectively gathered $107.92 Bn in May, the Vanguard S&P 500 ETF (VOO US) gathered $18.69 Bn alone.
Source: ETFGI

NEWSLETTER SIGN UP
And receive exclusive articles on securities markets
🏆 The 2026 Global Markets Choice Awards are here! 🌍 Nominations are officially OPEN for the celebration of excellence in global capital markets trading & technology. Nominate below:
https://www.jotform.com/form/260086385121150
Delaware Life Insurance Company is becoming the first insurance carrier to offer an index that contains cryptocurrency, adding the BlackRock U.S. Equity Bitcoin Balanced Risk 12% Index to its fixed index annuity (FIA) portfolio.
As the digital assets industry pushes toward
Franklin Templeton is expanding its tokenized fund suite, signaling growing institutional demand for blockchain-based fund infrastructure and regulated investment products moving onchain. Read the full article below:
$50 billion in active ETF inflows helped fuel a record year for @BlackRock 's iShares business, as investors continue to lean into active strategies.
Related articles
-

They are developing investment solutions based on tokenisation and blockchain.
-

Claude is being put directly into the hands of teams managing investments & client relationships.
-

Event-driven markets are becoming core to how sophisticated investors express macro views.
-

The fund may seek to use blockchain technology to record share ownership in the future.
-

The partnership reflects the continued evolution of Janus Henderson’s blockchain strategy.