


Let me just get this out in the open. My son has a rabbit, but I am not a fan of said rabbit. It’s name is Dusty because it is gray and it looks like a…wait for it… dust bunny. It does not go for walks. It does not catch a flying disc. It does not protect my house or catch mice in the barn. These are all things that “pets” should do in my opinion. I have no desire to hold a rabbit or watch it run around on my back patio.
The agreement to allow my son to adopt Dusty was forged by my wife. She let me know how “cute” bunnies are and that I would never have to do anything with regards to care and upkeep of the bunny. For the record, this agreement was upheld when Dusty was a “bunny,” but apparently I did not hear the fine print in the verbal contract that said my responsibilities would begin when Dusty matures from “cute” bunny to “ordinary” rabbit.
My own personal experience has led me to draw the following conclusion about the Italian Mathematician Leonardo Fibonacci. He had to have been married with children. Why else would he have spent so much time evaluating rabbits? It makes sense, doesn’t it? The kids bring home two bunnies and they ask if they can keep them. Leonardo says no, but Mrs. Fibonacci says “oh Leo, but they are sooo cute. You won’t have to do anything. The children will take care of them.” There you have it. The beginning of what we now know as the Fibonacci sequence and this sequence could be the key to projecting whether the S&P 5000 will trek high or pullback now that it has hit the 2,000 threshold.

Chris Irvin, Market Traders Institute
To be honest, I don’t really know if Fibonacci was married or had children but the one thing that I do know is that his observation of the breeding habits of rabbits helped to provide the mathematical foundation for a tool that many traders use to help identify hidden levels of support and resistance on price charts.
Most people are at least familiar with the Fibonacci sequence in which each number in the sequence is the result of the two numbers that precede it.
0+1 = 1 / 1+1 = 2 / 1+2 = 3 / 2+3 = 5 / 3+5 = 8 / 5+8 =13 / 8+13 = 21 / 13+21 = 34 / etc.
For technical traders, this sequence is at the heart of one of the most powerful tools used to project future price levels of futures, currencies, as well as equities markets. The numbers that make up the Fibonacci sequence are not used by traders directly. Instead, it is the ratios that are created by the relationships between the numbers in the sequence. For instance, after the seventh number in the sequence, if you divide one number in the sequence by the number before it, you end up with the ratio 1.618. This number is referred to as the “golden ratio” or the “golden mean.” So what makes it “golden?” Stick with me here. When you divide a line into two parts, so that the longer part divided by the smaller part is equal to the whole length divided by the longer part, you have a “golden” ratio.
Sometimes a picture adds clarity to a long confusing sentence.
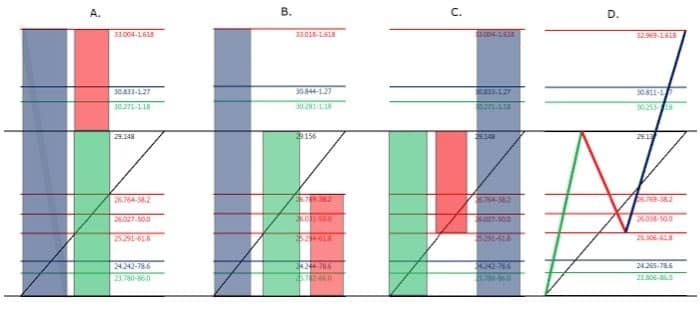
In the illustration above, “A” is an example of how the red segment along with the green segment equal the height of the blue segment. So, if we consider the green segment to measure one, and the blue segment is 1.618 of the green segment, then the red segment must by definition be .618.
Image “B” demonstrates that the green segment (1) is to the blue segment (1.618), as the red segment (.618) is to the green segment (1). The relationship between these segments (1 / 1.618 / .618) demonstrates the the “golden ratio.” Image “B” also shows us that there is symmetry to this ratio.
So how do traders use these Fibonacci ratios? If we measure a stock’s movement in three phases, I would typically consider the initial move to be the rally, the second move to be the retracement and the final move to be the extension. The rally is always measured from zero at the low point to one at the highest point. We know that stock prices do not move in straight lines so the next phase of the upward move must be a retracement. The retracement will be a percentage of the initial rally move of one. In illustration “C” I have used our red segment (.618) as the retracement. This was not done randomly. Due to the power of the natural golden ratio, it is not uncommon to see stock chart retracements fall back to the .618 level. After the retracement phase of the upward move has completed, the final push to the extension target will begin. The extension phase of the three part upward move will target the final ratio of the three (1.618). Illustration “D” provides a line diagram of the three phases of the upward move.
Not every upward price movement on a chart will move in exactly the same relationship (1:.618:1.618), but most of the wave patterns have their roots in this ratio sequence.
Now for the application. What does this information tell us about where the S&P 500 is headed since the psychological 2000 barrier has been breached? Is it time for a pullback or is it headed higher? The current upward move did not include a retracement back to the .618 level, but instead there was a shallow retracement to the .382 zone. This article does not allow for enough time to explain how the .382 retracement fits into the equation, but based on the Fibonacci ratios that are at play currently, the extension has the potential to take the S&P 500 to the 1.618 which would be 2106.
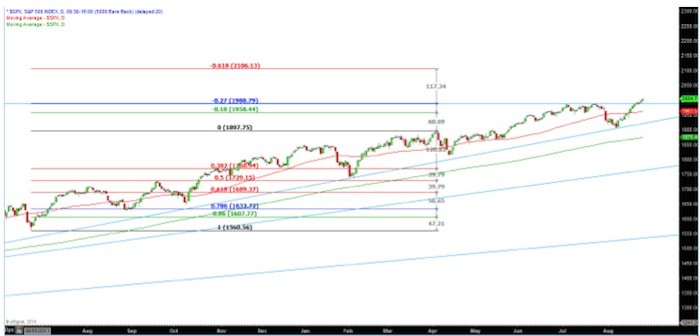
In my opinion, we need to keep in mind that there are Fibonacci ratios working in smaller timeframes within the larger timeframes. This means that there is a good chance we will see a near term pullback prior to reaching the projected 2,106 but as it stands now, it appears that all indications are leading us higher.
By Chris Irvin, Market Traders Institute
Irvin is director of options education at Market Traders Institute

NEWSLETTER SIGN UP
And receive exclusive articles on securities markets
As Technology Evolves, Asset Managers Adapt and Innovate
Citi Changes Organizational Structure
SEC Charges Virtu for Disclosures Relating to Information Barriers
ICE Futures Singapore Partners with CoinDesk Indices