


By Jeff O’Connor, Head of Market Structure, Americas at global unconflicted agency broker Liquidnet
As we head into the home stretch of 2025, a blend of cyclical conditions and structural shifts continues to shape liquidity in the US markets. The macro backdrop has remained clouded by uncertainty for much of the year—driven by a pivoting Federal Reserve, tariff unpredictability, persistent inflation, and lingering stagflation concerns. These forces have weighed heavily on trading conditions, directly influencing continuous volumes, liquidity availability, and spreads. At the same time, secular changes—most notably the migration of order flow to off-exchange venues and the sharp, ongoing decline in average trade sizes— are reshaping how liquidity is sourced.
The summer brought some notable countercurrents. Correlations dropped and volatility diminished, bucking the broader trends of 2025. Yet, overall conditions have remained highly conducive for market makers and high-frequency traders (HFTs), who now account for 45% of consolidated volume. Average trade sizes continue to fall, and a growing proportion of this activity is being executed on bank—and non- bank ATSs. Historically designed for block trading, ATSs have now become the primary venues for smaller trades—a striking reversal that underscores the depth of structural change.
Periods of heightened volatility or rising risk variance traditionally produce three effects: dark trading declines as market makers seek immediacy, average trade sizes contract as traders avoid block risk, and spreads widen as market makers demand greater compensation. These patterns have largely persisted through 2025. However, trader behavior has also shifted, with greater reliance on schedule-based strategies in volatile conditions, further reinforcing the trend of smaller-sized flow moving through ATSs. This dynamic has kept FINRA TRF-reported volumes elevated, in many cases surpassing exchange volumes.
Market-making and HFT conditions have been especially favorable, supported by higher realized price volatility, wider spreads, and thinner depth. The payment-for-order-flow (PFOF) feedback loop remains strong. Retail participation, meanwhile has defied historical precedent. Typically, rising volatility drives retail activity lower—as seen in April—yet retail investors did not retreat. Instead, they continued to support the “American Exceptionalism Trade,” sustaining passive inflows at a time when institutional participation pulled back. IF this persistence holds, retail could continue to drive growth in small-order flow, off- exchange activity, 24-hour trading products, and event trading in sub-$1 names.
Seasonality also plays a role in the current backdrop. September has historically produced the weakest equity returns and the lowest retail participation of the year. Yet, signs of stabilization have quietly emerged. Intraday volatility has receded, with the S&P 500 now more than 90 days without a daily move of ±2%. Realized correlations have dropped to historically low levels, last observed in 2024, when steady institutional flows provided the market with both depth and resilience.
For portfolio managers and traders, these developments suggest a healthier trading environment. At the same time, risk remains elevated. The coming weeks will be shaped by critical macro catalysts: employment data, inflation readings, and the FOMC meeting. With Q3 earnings surprising to the upside and the odds of rate cuts steadily increasing over the past two months, much of this optimism appears priced in. As the macro story unfolds, its outcome will not only steer the direction of equities and the broader economy but will also determine how—and where—liquidity is sourced in the months ahead.
Source: Liquidnet Analytics
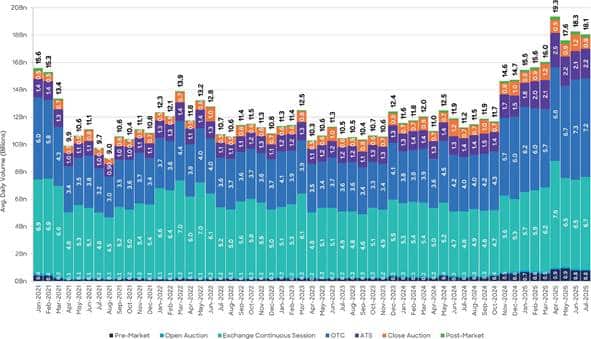
Through August, market activity has surged to unprecedented levels, as illustrated in Exhibit 1. The 2025 daily average of 17.1 billion shares represents a +47% increase compared with both last year and the four-year average. One of the most enduring legacies of the Covid era has been the structural migration of trading from exchanges to off-exchange venues. Now, five years removed from the onset of the pandemic, this shift has only accelerated. Off-exchange activity consistently accounts for more than half of total reported volumes, underscoring the scale of this transformation.
Retail remains exceptionally strong—at the highest sustained levels on record—despite elevated volatility.
PFOF has surpassed $1 billion per quarter, reflecting the strength of retail-driven activity. In 2025, this has created a unique mix: market makers capitalizing on wider spreads, systematic funds exploiting momentum and volume-driven opportunities, and retail investors maintaining a resilient bid. Together, these forces have tilted consolidated volumes increasingly toward non-traditional sources of flow.
Non-bank market makers and high-frequency trading firms now account for close to 45% of consolidated volumes. Favorable conditions—realized price volatility, thinner depth, and the absence of consistent institutional participation—have amplified their share. At the same time, the execution landscape continues to evolve. A growing proportion of small-sized orders are being routed to ATSs, which, once primarily associated with block facilitation, have effectively reinvented themselves as destinations for fragmented retail and small institutional flow.
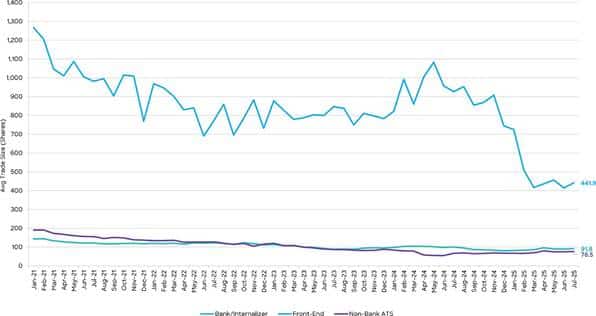
Trade sizes on exchanges have historically been small compared to the block-oriented activity that once defined ATSs and upstairs cash trades (classified as OTC). However, the rapid expansion of market-making activity and its growing influence within ATSs has dramatically reshaped the landscape. Today, ATSs—once the primary venues for block facilitation—now account for the smallest average trade sizes in the market, as illustrated in Exhibits 2 and 3. While certain ATSs continue to serve a role in block sourcing, the distinctions between exchange trading and ATS activity has become increasingly blurred.
How Trade Sizes have dipped amongst all ATS types
Source: FINRA OTC Transparency Data
As seen in the exhibit, the contraction in trade sizes has been widespread across the ATS landscape, extending even to venues traditionally associated with block trading – particularly those offering front- end or desktop applications. Notably, both bank-affiliated/internalizing ATSs and non-bank ATSs have seen their average executions fall into odd-lot territory. By Q2 2023, both groups had dropped below the standard 100-share threshold, underscoring the extend of the shift away from block-oriented activity.
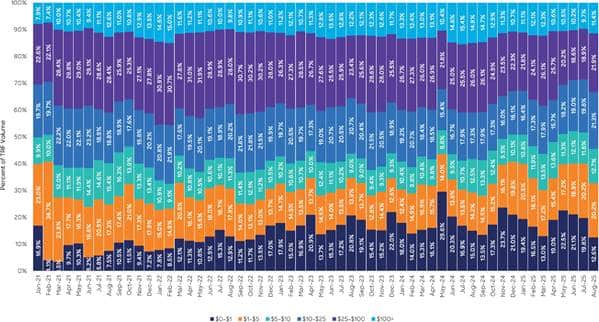
Moving away from the historical—though arguably outdated—definition of a block as 10,000 shares or more, the ATS landscape is now dominated by sub-2,000-share executions. After averaging just over 1.1 billion shares per day through August 2024, volumes in this category have surged by 61% in 2025, reaching 1.8 billion shares per day. These smaller prints now represent more than 84% of total US ATS volume, highlighting the dramatic shift in trade size comparison, as highlighted in Exhibit 5 above.
At the forefront of the evolving ATS landscape is the rapid expansion of non-bank ATSs, illustrated in Exhibits 6 and 7. While their upward trajectory began in late 2022, recent market conditions have accelerated their growth, bringing their share to just under 40% of the ATS market. Venues offering non-traditional crossing mechanisms—such as private rooms, matching delays, or trajectory-based functionality—are driving this momentum. As a result, the historical gap between bank-operated venues and the broader ATS community continues to grow.
Although spreads have retreated from the April highs sparked by Liberation Day, they remain elevated, as seen in Exhibit 8. Through August 2025, the daily average bid-offer spread is still 50% wider than during the same period in 2024. As macro uncertainty begins to ease, shifts in the sourcing of liquidity are likely to follow, reshaping where and how participants access the market.
Reflecting the elevated bid-offer spreads, the Daily Cost Factor has risen in parallel, illustrated in Exhibit 9. Through 2025, the average daily cost to trade is up 36% compared with last year, highlighting the sustained impact of wider spreads in execution costs.
While market volatility appears to be easing, the elevated levels that defined the second quarter of 2025 have begun to recede, as seen in Exhibit 10. This decline signals a healthier trading environment, providing more stability for both institutional and retail participants.
Conclusion: Retail, Overnight Activity, and Structural Implications
Source: Liquidnet Analytics, FINRA OTC Transparency Data
As highlighted in the exhibit, sustained record-high market volumes have increasingly been driven by the $0-$1 stock segment, highlighting the strength and persistence of retail participation. Retail investors have remained active, even amid volatility and market downturns, reinforcing their growing influence on overall market flow.
This activity is complemented by the expansion of 24-hour trading, particularly driven by Asia-based retail, which has enhanced both competitiveness and access in US markets. Several ATSs and exchanges now offer around-the-clock trading to accommodate this global flow. While institutional demand remains relatively muted, continued growth in these small-sized and off-hour volumes could begin to attract larger participants, as overnight price developments generate scalable trading opportunities.
Taken together, these trends underscore the evolving nature of liquidity sourcing in the US equity market. The rise of retail-driven flow, the proliferation of non-bank ATSs, the dominance of small-sized prints, and the increasing importance of 24-hour trading all point to a market structure where traditional measures of liquidity – exchange-based block trades and continuous institutional participation – are no longer the sole determinants. As the market continues to adapt, participants will need to navigate a landscape shaped by fragmented execution venues, varied trade sizes, and a growing interplay between retail and institutional activity around the clock.
Source: Liquidnet

NEWSLETTER SIGN UP
And receive exclusive articles on securities markets
It's been a month since we had our Women In Finance Awards in New York City at the Plaza! Take a look back tab some moments, and nominate for our upcoming awards in Mexico City and Singapore here: https://www.marketsmedia.com/category/events/
4Citadel Securities told the SEC that trading tokenized equities should remain under existing market rules, a position that drew responses from various crypto industry groups. @ShannyBasar for @MarketsMedia:
SEC Commissioner Mark Uyeda argued that private assets belong in retirement plans, saying diversified alts can improve risk-adjusted returns and that the answer to optimal exposure “is not zero.” @ShannyBasar reporting for @MarketsMedia:
COO of the Year Award winner! 🏆
Discover how Jennifer Kaiser of Marex earned the 2025 Women in Finance COO of the Year recognition.
Related articles
-

Investors and brokers are using automation and new technologies to make the most of this upswing.
-

DeFi has secure access to equities data including after-hours and overnight sessions for the first time.
-

ICE’s derivatives markets and its equity markets at NYSE set multiple milestones in 2025.
-

The new venue will support trading of tokenized shares that are fungible with traditional securities.
-

The suite had record futures and options average daily volume and open interest last year.