


Making the Case for an Investment When the Analytics Don’t Fit (By Guy Benstead, Cedar Ridge Partners)
04.14.2016Exploring the flaws inherent in the way bond funds are often classified
A few months ago, I was meeting with a prospective investor for whom I’d run multiple scenarios on our funds and shared detailed analyses as to how certain investments would fit within his existing portfolio.
At one point in our discussion, this investor, whom we’ll call “Gary”, stopped me in my tracks. According to Gary, there was a major discrepancy between the information I was sharing with him and his own research. These were statistics — how could they disagree?
This wasn’t the first time I’ve had this discussion with a would-be investor, and I’m sure it won’t be the last. The reason for the inconsistencies between Gary’s analysis and my own are two-fold. One lies in a flaw that is inherent in the way funds are classified by some of the more prominent fund ranking groups, and the other stems from the analytical services used by retail investors and RIAs to measure bond funds.
At approximately $40 trillion in size with more than $785 billion in average daily trading volume, the U.S. bond market represents a major slice of the investment landscape. Despite this significance, the analytical tools probing the fixed income market for bond mutual funds are often confusing and produce inconsistent results.
Assignment of Bond Fund Categories Can Discount True Performance
One reason for this flaw, as I saw in working with Gary, lies in how bond funds are categorized, with many investment philosophies lumped into a single category despite their divergent strategies, risk profiles and return potential. As most investors can attest, the descriptive names of bond fund types, including “Strategic Income,” “Total Return,” “Opportunistic,” “Market Neutral,” “Short Duration,” “Unconstrained” and “Alternative Credit,” provide little insight into how the fund is actually managed.

Guy Benstead, Cedar Ridge Partners
The misleading nature of certain fund labels becomes an issue when prospective fund clients who are evaluating bond fund opportunities utilize analyses that don’t effectively compare funds with like-for-like substitutes. The problem this creates for active fund managers is that if would-be investors fixate on the wrong metrics against which to judge the success of a particular fund, they will most likely be chasing performance, and will fail to understand the more nuanced aspects of a particular fund strategy and risk/reward profile, thus clouding how the fund would fit into their overall investment allocations.
Recently Morningstar announced several changes to their fixed income categories, including the introduction of a new category specifically for Long/Short credit funds. This is a welcome change and a step in the right direction that I think will help investors better sort through the vast array of “alternative” fixed income funds that have come to market in just the past few years.
Demonstrating Your Bond Funds’ Potential
In order to remedy this situation and explain to investors like Gary how our funds should be evaluated, I have taken to using the Historical Fund Analysis (HFA) function in the Bloomberg Professional Service. By using HFA, I’m able to effectively demonstrate fund performance and suggest portfolio allocations that help clients achieve their goals.
In Gary’s case, he had been looking at the performance for long/short and unconstrained bond funds, using a widely-used industry data provider. As the majority of these funds lack a three-year track record, the resulting data was sparse when juxtaposed with other funds over a five-year time horizon. Specifically, running performance statistics using monthly data on funds with less than a three-year track record is prone to produce skewed results; there are simply not enough data points to draw statically significant conclusions. Worse yet the results may be statistically misleading, but taken alone and at face value, a potentially “good” investment allocation will not make it through a typical fund screen.
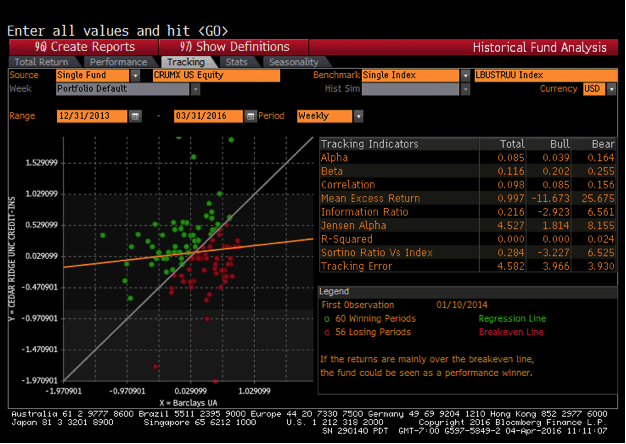
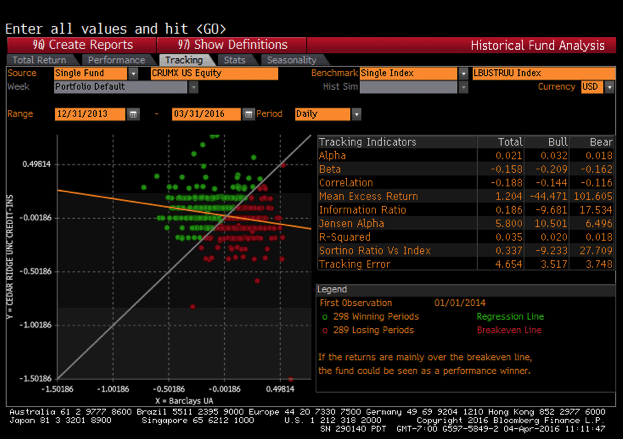
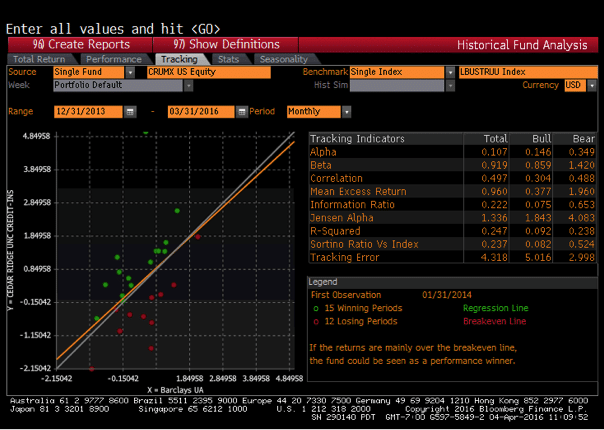
By using the HFA function, I was able to easily customize observation frequency to produce a meaningful number of observations. By changing the “Period” selection from “Monthly” to “Weekly” to “Daily”, I significantly improved the number of data points from 27 to 116 to 587, and thus produced more meaningful and quite different results. Specifically our fund’s correlation to its benchmark, Barclays Agg, dropped from 0.50 to 0.10 to -0.19, while mean excess returns improved from 0.96 to 1.00 to 1.20. By showing this revised analysis, I was able to change Gary’s outlook and demonstrate how our funds had actually performed against any number of comps, from indices to other mutual funds and ETFs. If the strength of a strategy lies in the fact that it is highly uncorrelated, HFA allows you to compare it to other such funds and gauge the strength of this claim.
The HFA function of the Bloomberg Terminal enabled me to not only provide a valuable, tailored analysis to a would-be investor, but also better understand what he was looking to get out of his new allocations.
Monthly CRUMX v AGG 12/2013 – 3/2016
Weekly HFA – CRUMX v AGG 12/2013 – 3/2016

NEWSLETTER SIGN UP
And receive exclusive articles on securities markets
🏆 The 2026 Global Markets Choice Awards are here! 🌍 Nominations are officially OPEN for the celebration of excellence in global capital markets trading & technology. Nominate below:
https://www.jotform.com/form/260086385121150
Delaware Life Insurance Company is becoming the first insurance carrier to offer an index that contains cryptocurrency, adding the BlackRock U.S. Equity Bitcoin Balanced Risk 12% Index to its fixed index annuity (FIA) portfolio.
As the digital assets industry pushes toward
Franklin Templeton is expanding its tokenized fund suite, signaling growing institutional demand for blockchain-based fund infrastructure and regulated investment products moving onchain. Read the full article below:
$50 billion in active ETF inflows helped fuel a record year for @BlackRock 's iShares business, as investors continue to lean into active strategies.