


This article first appeared as FLASH FRIDAY on Traders Magazine. FLASH FRIDAY is a weekly content series looking at the past, present and future of capital markets trading and technology. FLASH FRIDAY is sponsored by Instinet, a Nomura company.
In March 2023, three U.S. banks failed, triggering a sharp decline in global bank stock prices. In light of the banking crisis, Pat Mohr, Executive Director at Instinet, shares his thoughts on market-on-close activity (MOC).
What are the issues raised around market-on-close (MOC) activity?
Globally we have seen a growing trend towards more volume on the close. This is often associated with the rise of passive investing and growth of ETFs as MOC tends to be the preferred trading style for these funds. The FRB issued a study that suggested a growth in the passive portion of Mutual Funds+ETFs has grown from less than 2% in 1995 to more than 35% in 2018:
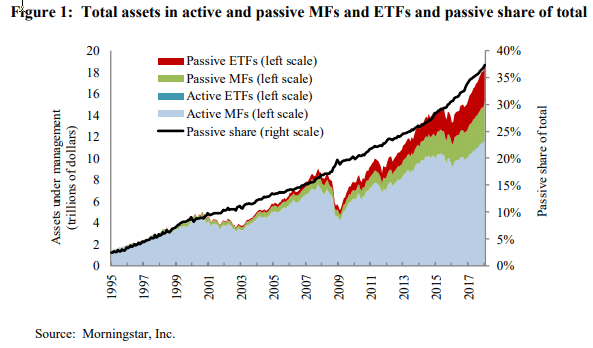
So the first point is that we have a long term trend toward more volume on the close driven by the shift from active to passive investing.
This effect is punctuated by extreme volume on the close on index rebalance days (MSCI, FTSE, S&P, Russell, etc).
Five years ago Instinet launched a product called the “Global Auction Monitor” to more closely analyze this trend of increasing volume on the close. The product provides a daily/weekly/monthly time series of volume on the close as a % of total volume for MSCI indices (i.e. global, developed, emerging and 40+ countries).
There are a number of factors impacting volume on the close:
- As mentioned above, over the long term the shift from active to passive is key
- Index rebalance days result in tremendous volume on the close
What we have discovered from our Global Auction Monitor is that there are a number of other interesting effects at play. The first point is a powerful seasonality effect.
In the chart below we plot volume on the close as % of total volume for MSCI All Country World Index (Developed + Emerging). From a time series analysis perspective there are three interesting points: (1) the tendency for proportional auction volume to rise and fall every 3 months and (2) the fact that this seasonality effect broke down in March 2020 and proportional closing auction volumes dropping dramatically and then (3) proportional auction volume gradually recovering after the pandemic first hit.

Seasonality
For the first attribute what we are seeing an increase in proportional volume on the close in the 3rd month of each quarter and then it falls back in the first month of each quarter. We generally associate this effect with quarter end asset allocation shifts away from active funds to passive funds. The effect is global in nature and we tend to see it virtually every country. I would also note that for this analysis we are excluding index rebalance days because we know they will skew the data higher.
Breakdown of Seasonality in March 2020
The other interesting thing to note is that this seasonality is very powerful—appearing every quarter—but the effect broke down in March 2020. Our explanation for this is that after the pandemic hit intraday volatility was extremely high and investors simply were not willing to take the time risk of waiting until the end of the day to trade. As a result, much of the traditional MOC volume migrated away from the close to execute in the continuous session.
Resumption of Seasonality in June 2020
Three months later the quarterly seasonality effect was back but at a much lower level from three years prior. Gradually we have seen global volume on the close recover but we still haven’t gotten to the peak we reached in December 2020.
What are the key drivers behind this activity? / Can you give us March rebalance highlights?
The comments above are more generalized observations that apply to non rebalance days. Rebalance days are a completely different animal. The S&P rebalanced on March 17.
The following is information we shared with clients that day. One great example is FICO UN (Fair Isaac). It was an addition to the S&P 500. The stock’s average 20 day closing auction volume is 25,000 shares. On rebalance day it was 2.66 million shares(!).
S&P 500 closing auction turnover today was 7X normal.
S&P 400 closing auction turnover today was 10X normal.
S&P 600 closing auction turnover today was 17X normal.
Top 10 names ranked by % increase and notional increase in closing auction volume in the S&P 500:

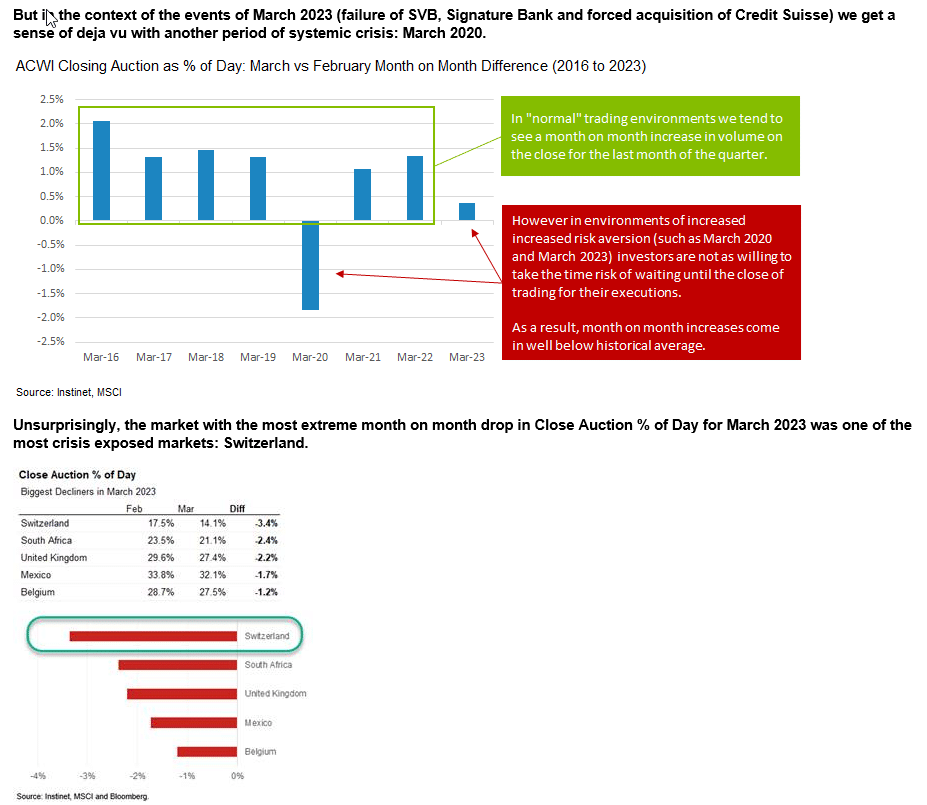
Can you comment on the underwhelming performance of closing auction volumes and the similarities between the periods of systemic crisis in March 2023 and March 2020?
Again, its important to discriminate between rebalance and non rebalance days. The analysis below excludes the skewing influence of rebalance days.
Earlier we commented on the effects of March 2020. For March 2023 we were also in a heightened volatility environment in response to crises in the financial system related to Silicon Valley Bank and Credit Suisse. It wasn’t as extreme as March 2020 but it was still very significant. What we found was that the quarterly seasonality effect for March 2023 was the second weakest we have observed in 8 years (March 2020 was the weakest and the only time month on month % chg in proportional volume on the close went negative). The chart below demonstrates this effect. Typically we see a 1% increase in March vs February but in March 2023 we only saw a 0.3% increase.

What are the benefits and risks of MOC orders?
The old saying “liquidity begets liquidity” applies to MOC. It’s generally the most liquid trading time of the day. The downside is the heightened volatility.
Why do institutional traders place enormous importance on closing stock prices as benchmarks of value?
Passive funds (and many active funds) are marked to market at the close so it’s the most important price of the day for them.
What are your perspectives on market-on-close activity going forward?
- The long term trend toward ETF growth suggests more passive investment leading to more volume on the close
- But there will be bouts of occasional extreme volatility when proportional closing auction volume will recede
- We expect the quarterly seasonality effect to continue—which suggests more month on month proportional volume on the close in the 3rd month of each quarter and less in the first month of each quarter.
- At the country level there are a lot of idiosyncracies that will continue to impact individual markets. For example, the mainland Chinese markets have a closing auction mechanism but the authorities discourage investors to use it. As a result, proportional volume on the close in the mainland is the lowest of any market in MSCI All Country World—and these markets have the highest % of volume in the last 30 minutes.

NEWSLETTER SIGN UP
And receive exclusive articles on securities markets
It's been a month since we had our Women In Finance Awards in New York City at the Plaza! Take a look back tab some moments, and nominate for our upcoming awards in Mexico City and Singapore here: https://www.marketsmedia.com/category/events/
4Citadel Securities told the SEC that trading tokenized equities should remain under existing market rules, a position that drew responses from various crypto industry groups. @ShannyBasar for @MarketsMedia:
SEC Commissioner Mark Uyeda argued that private assets belong in retirement plans, saying diversified alts can improve risk-adjusted returns and that the answer to optimal exposure “is not zero.” @ShannyBasar reporting for @MarketsMedia:
COO of the Year Award winner! 🏆
Discover how Jennifer Kaiser of Marex earned the 2025 Women in Finance COO of the Year recognition.
Related articles
-

This is the first time regulated public equity can be used directly in an onchain borrowing market.
-

The firm aims to become the 'Everything Exchange' for trading.
-

The new tape will be the unified successor to the three existing consolidated equity market data feeds.
-

These are real, regulated public shares: issued onchain and recorded directly on the issuer’s cap table.
-

The regulator founf stronger practices compared to its 2014 thematic review.