


By Ted Husveth, Managing Director, U.S. Credit, Tradeweb

Ted Husveth, Tradeweb
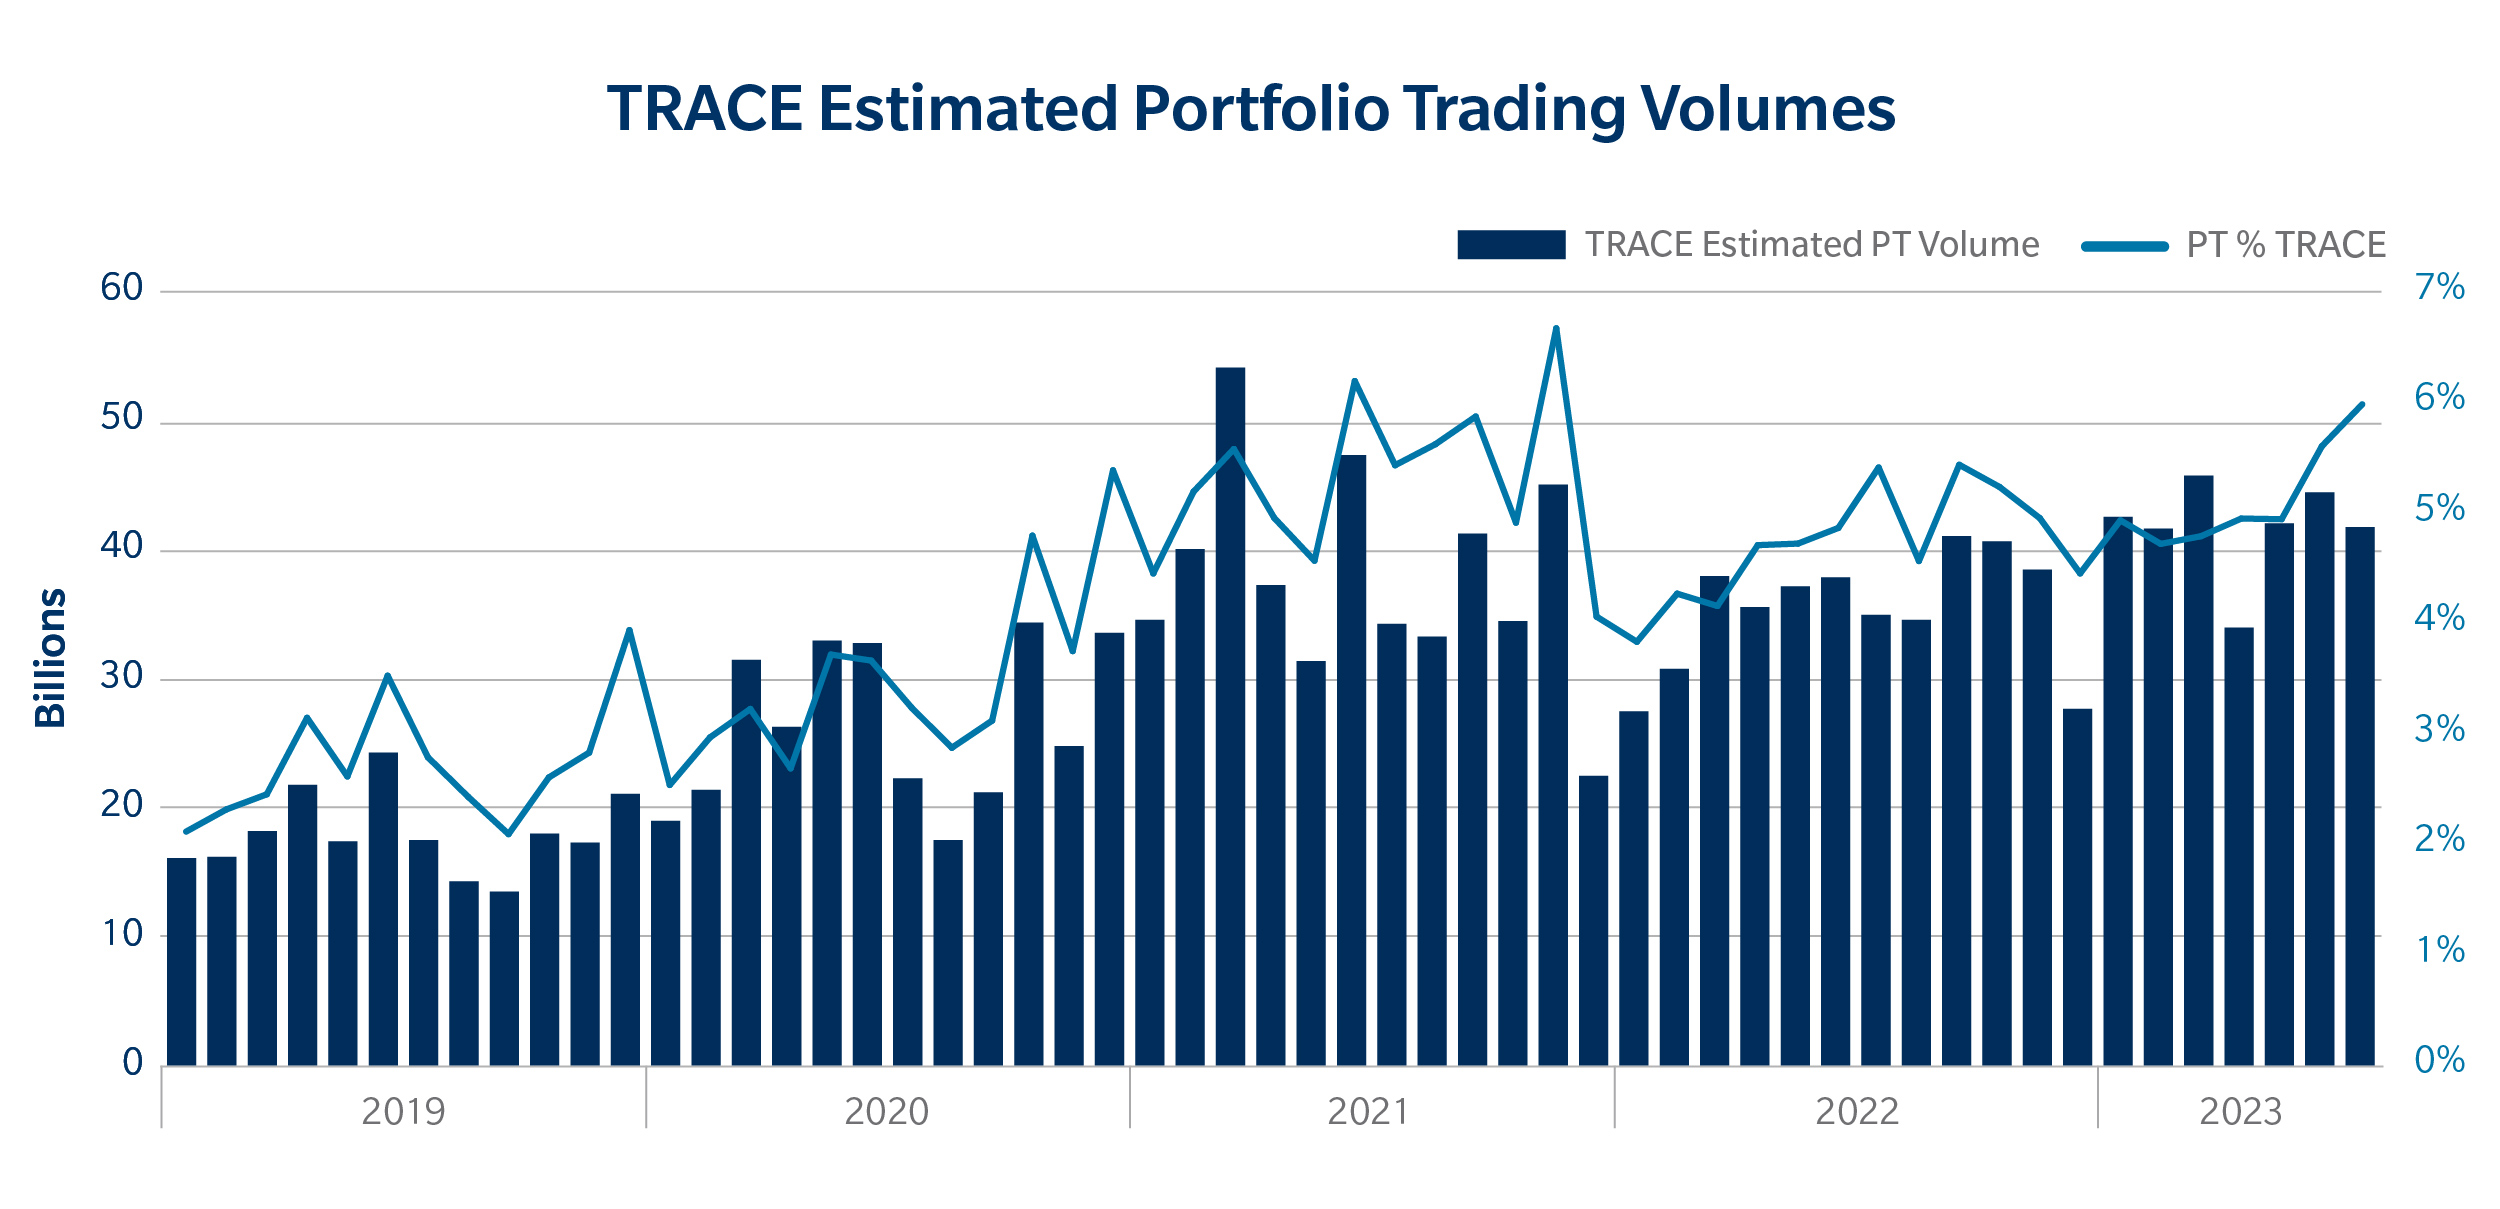
The first half of 2023 offered a volatile macro backdrop for U.S. credit markets, as elevated inflation, rates uncertainty and an ongoing banking crisis continued to weigh on our markets. Despite these hurdles, one constant theme in credit markets has been the use of portfolio trading to move large baskets of risk. Tradeweb has been the market leader in electronifying this protocol and our growth has continued through 2023, with combined U.S. Investment Grade (IG) and U.S. High Yield (HY) volumes in portfolio trading up 22% in the first half of 2023 compared with prior year period. This momentum continued into July; we estimate portfolio trading made up 6%[1] share of total TRACE in July 2023, which is the highest we’ve seen since November 2021.
In this piece we highlight some of the trends we’ve seen in portfolio trading over the first six months of 2023 – and what this could mean for the next wave of portfolio trading innovation. For example, in response to growing client engagement and interest in using the protocol in different ways, we recently introduced ‘Bulk Crossing’ functionality within portfolio trading to allow clients and dealers to trade more efficiently by trading hundreds (or thousands) of corporate bonds with Treasury hedges, while consolidating the numerous Treasury trades into one ticket per benchmark. This feature allows both clients and dealers to trade more efficiently by reducing their number of tickets, and has grown in popularity for both Net Proceeds and Trade-at-Close (or Ref+) portfolio trades.
Measuring The Size Of The U.S. Portfolio Trading Market – An Update
On May 15, 2023, the FINRA TRACE reporting rules took effect which require dealers to start reporting their portfolio trade transactions to TRACE. This change signifies how far portfolio trading has come over the past five years; it is a testament to the increased electronification of this protocol and of credit markets more broadly. The new requirements allow market participants to achieve a better understanding of the size of the market and therefore adjust their pricing models to consume these trades in a more informed way. This new reporting metric has also allowed us to validate our model for estimating portfolio trading market size on TRACE (discussed in more detail here). We will continue to monitor the performance of our portfolio trading estimation model as more portfolio trades are tagged on TRACE over the coming months.
Portfolio Trading Execution Volumes Vary Throughout The Month
Portfolio trading is utilized by clients for a multitude of reasons. This can range from very specific sector level views to huge monthly or quarterly rebalances. Month-end tends to be a popular time for portfolio trades for a variety of reasons. Below we illustrate the average day’s volume given its position in the month during the first half of 2023 vs the first half of 2022. Looking at the chart below, the final week of the month averaged 42% more volume as compared to the previous weeks during the month. This trend helped drive the overall increase in portfolio trading over the last year.
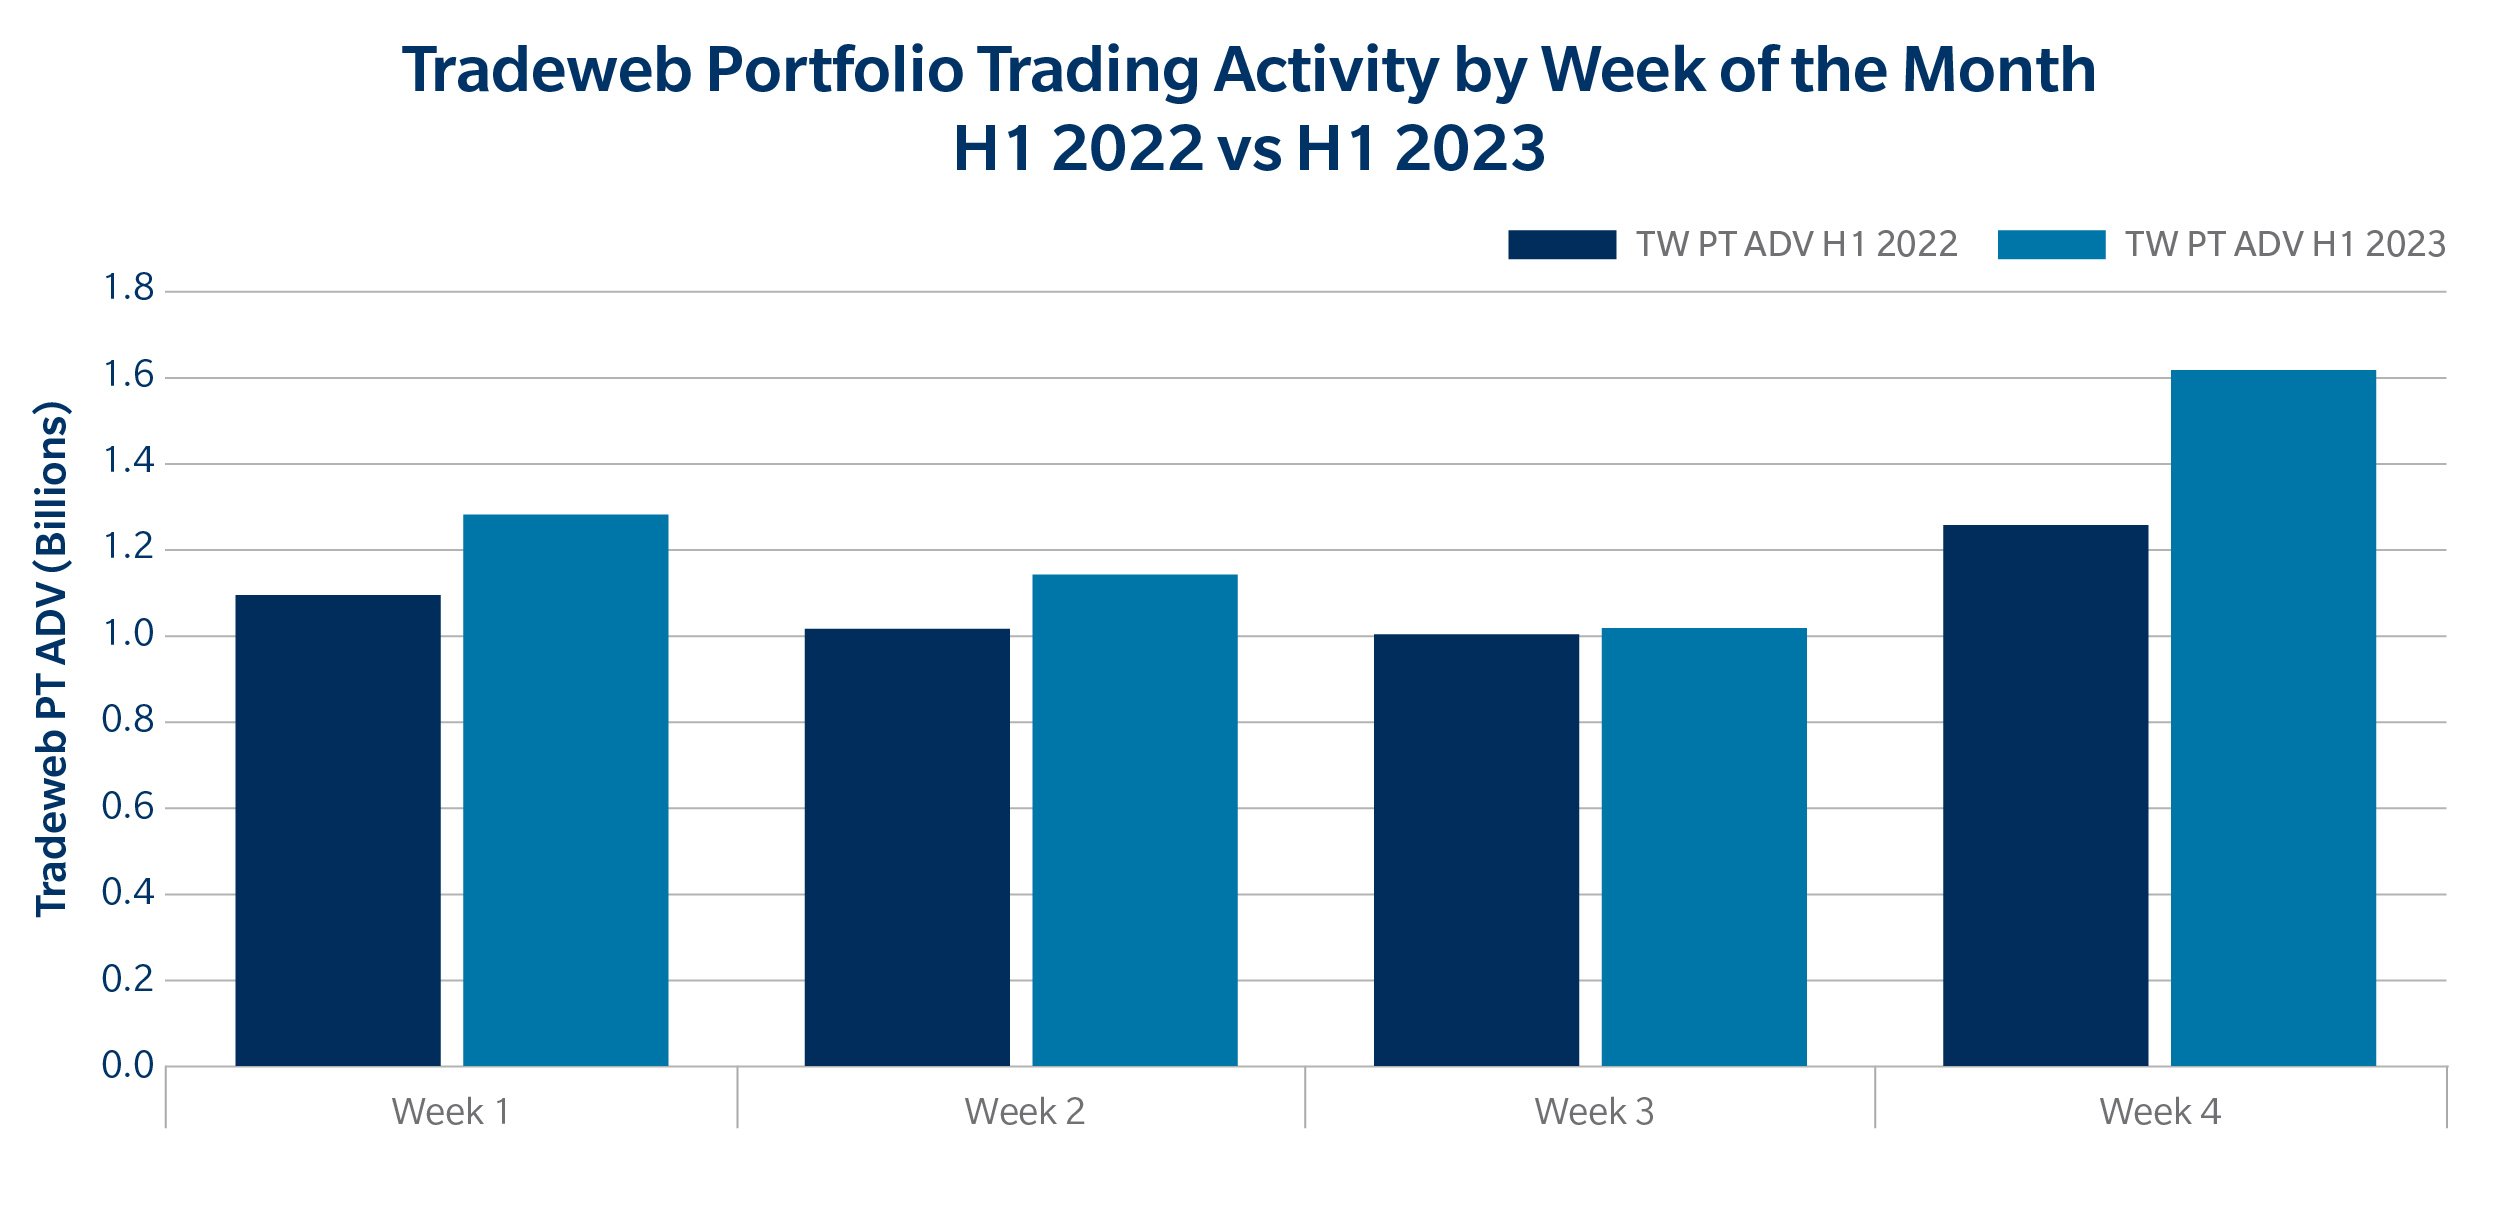
One reason that month-end is a popular time for portfolio trades is that the protocol provides an easy way for clients to rebalance their portfolio to maintain their monthly mandates and exposures. These types of rebalancing trades are typically slightly larger in size and have more line items than other portfolio trades. We can see this activity in the data: in H1 2023, portfolio trade baskets traded on Tradeweb during the last three days of the month averaged 17% more volume and 47% more line items as compared to portfolios traded during the previous days of the month. Portfolio trades near month-end also tend to include more distinct sectors in their make up as compared to portfolio trades happening at other times of the month. Although this is not a direct measure of diversity in bond portfolios, this larger sector range is also indicative of these rebalancing type trades.
Portfolio Trading Execution Quality
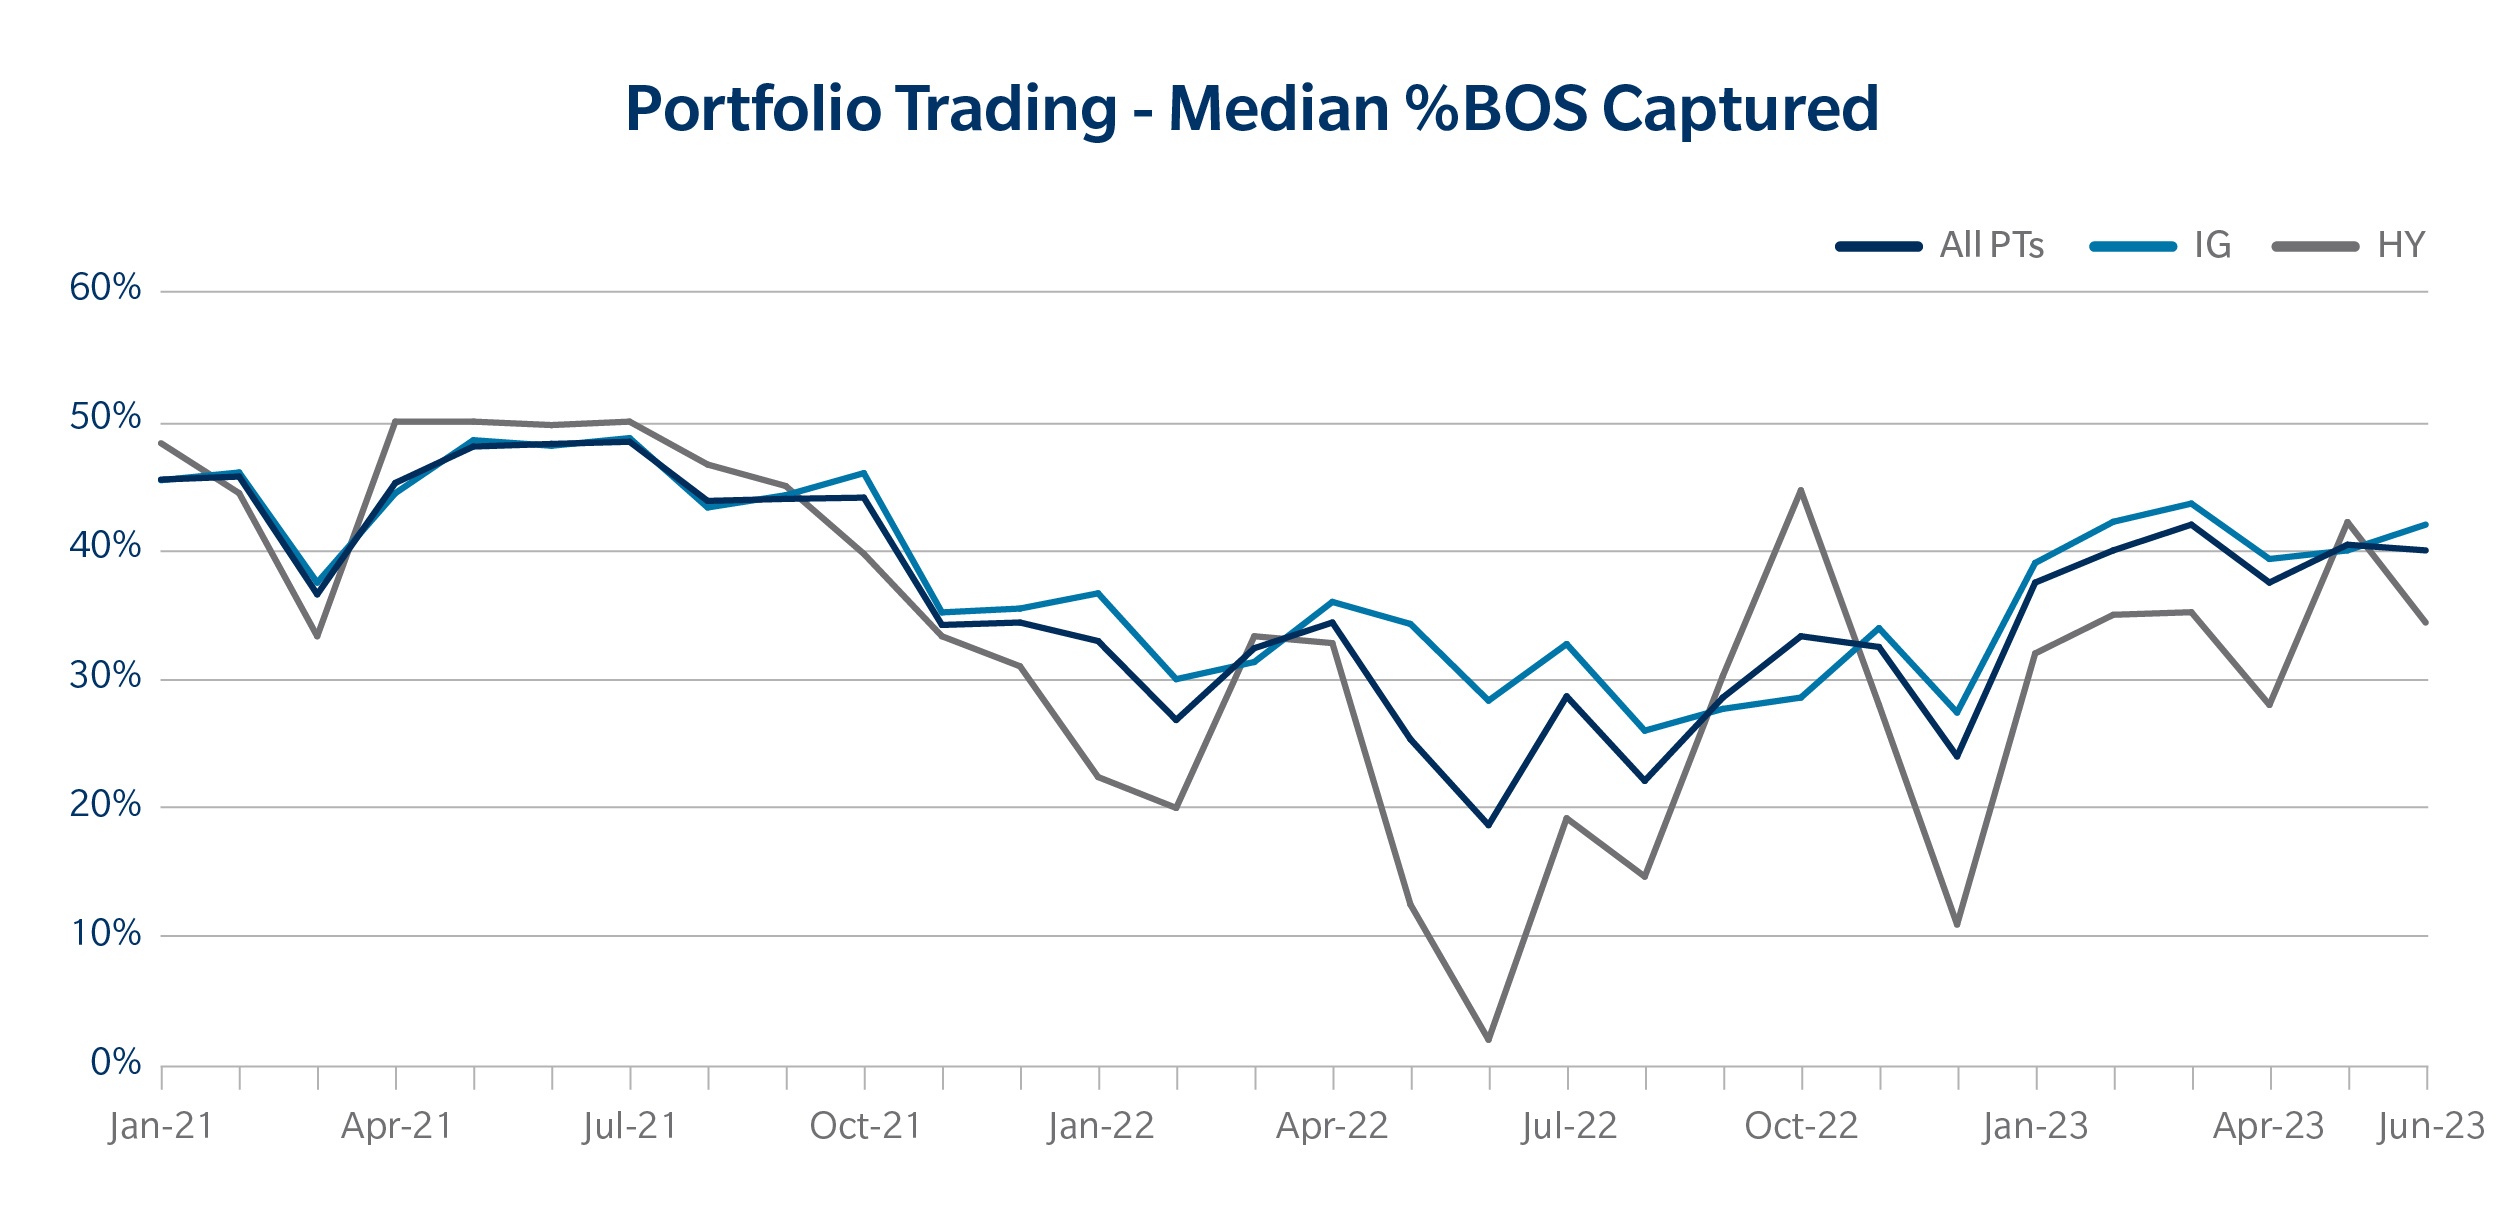
As discussed in earlier blog posts, there are several ways of measuring execution quality for trading in credit markets. One metric we use in our transaction cost analyses is the percentage bid/offer spread captured (%BOS). This is simply the percentage of Tradeweb Ai-Price bid/offer spread that the traded level captured. In H1 2023, we saw improvements in portfolio trade execution quality compared to H1 2022. The median %BOS captured is now very close to mid and has almost returned back to 2021 levels. HY portfolio trade execution quality has also significantly improved since the beginning of the year, despite HY TRACE having fallen around 4% from H1 2022 to H1 2023.
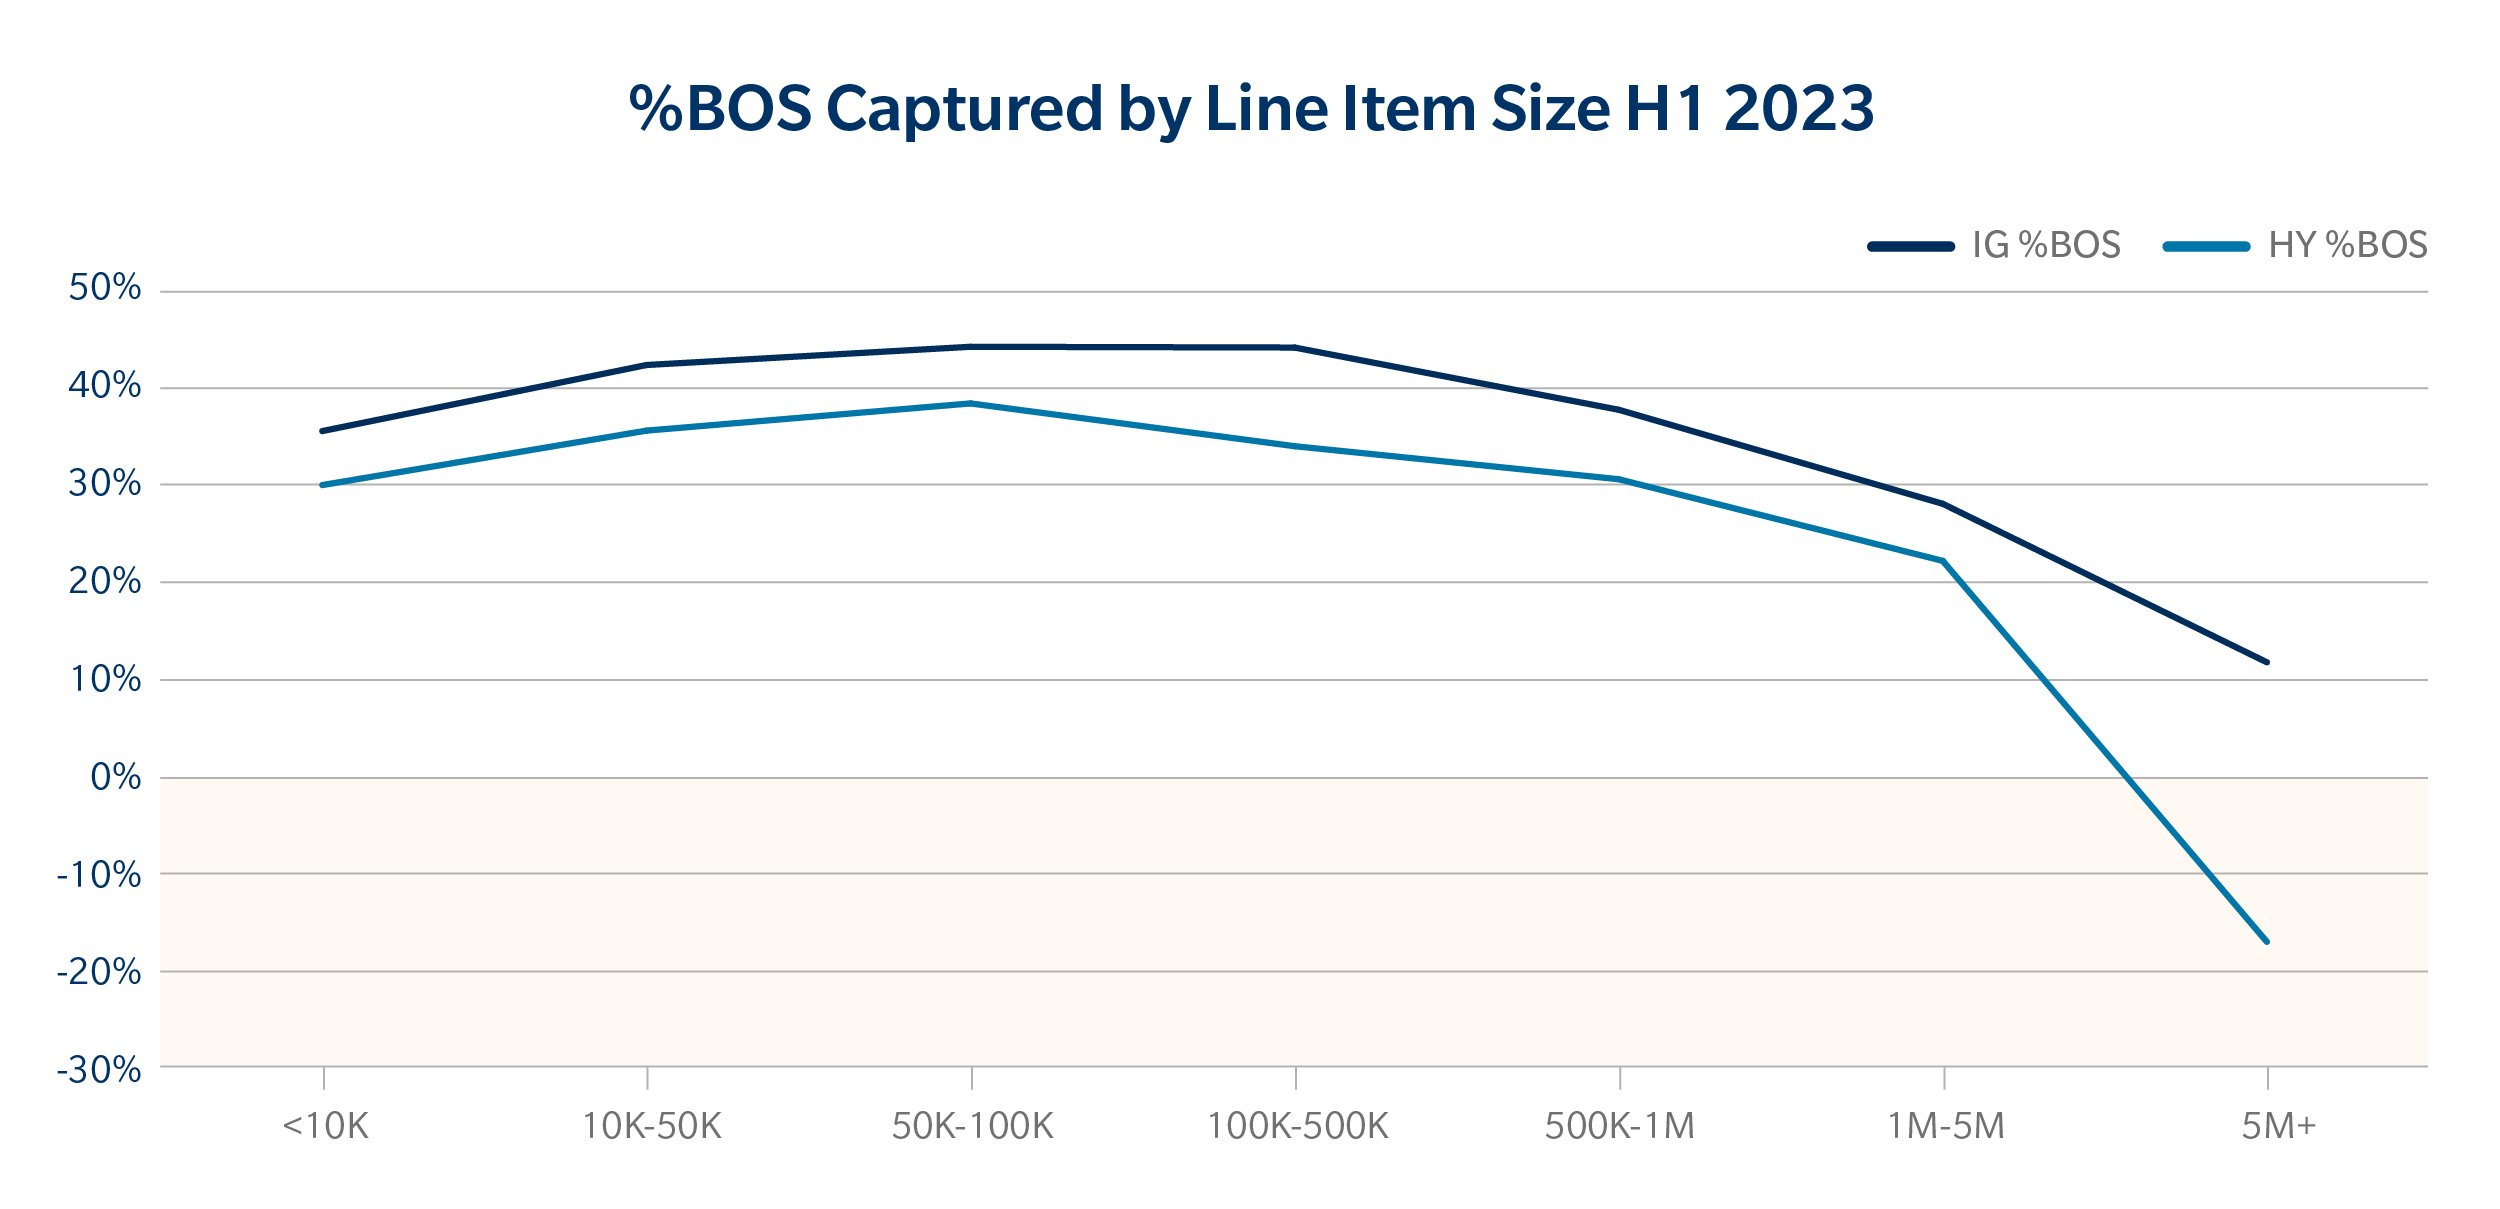
We also previously discussed the factors that drive portfolio execution quality at the portfolio level. One interesting trend we wanted to explore further was execution quality at the line level in a portfolio trade and how it varies by size. Intuitively, we would expect higher execution costs on chunkier lines in the portfolio due to a size premium, but also potentially higher costs on those with very small size. This is because a client may be willing to incur slightly higher costs on small trades in order to obtain the certainty of execution on these items.
Using H1 2023 Tradeweb portfolio trading data, we looked at how the %BOS captured varied by line size. We can clearly see both in IG and HY that execution quality falls as line size increases, which is expected due to the extra cost associated with trading large sizes. The chart also implies that the optimal size for execution quality is around 50k-500k for IG and 50k-100k in HY, which corresponds with what we tend to see on average for portfolio trades on our platform. The inverted U shape is also indicative of the ‘small trade’ effect where trade costs may be slightly higher for very small line sizes. This implies that clients are willing to accept comparatively worse levels on those bonds since they know they are able to trade them with certainty as part of the broader basket. This effect, however, seems to be much smaller than the higher costs associated with larger line sizes and is still well inside the bid/offer.
Looking Forward
Even as TRACE volumes declined in Q2 2023 as compared with strong comps in Q1 2023, we’ve seen portfolio trading continue to maintain its significant share of the overall market, and we believe it is here to stay. As the protocol evolves, such as we have seen with the use of Bulk Crossing, we are confident that clients will continue to leverage portfolio trading in innovative ways, and in every market condition.
Related Content
Deciphering the Size of the Portfolio Trading Market
Portfolio Trading Trends: A Breakdown of 2022
[1] Based on TRACE

NEWSLETTER SIGN UP
And receive exclusive articles on securities markets
🏆 The 2026 Global Markets Choice Awards are here! 🌍 Nominations are officially OPEN for the celebration of excellence in global capital markets trading & technology. Nominate below:
https://www.jotform.com/form/260086385121150
Delaware Life Insurance Company is becoming the first insurance carrier to offer an index that contains cryptocurrency, adding the BlackRock U.S. Equity Bitcoin Balanced Risk 12% Index to its fixed index annuity (FIA) portfolio.
As the digital assets industry pushes toward
Franklin Templeton is expanding its tokenized fund suite, signaling growing institutional demand for blockchain-based fund infrastructure and regulated investment products moving onchain. Read the full article below:
$50 billion in active ETF inflows helped fuel a record year for @BlackRock 's iShares business, as investors continue to lean into active strategies.
Related articles
-

Crypto is getting a market-priced yield curve.
-

CalSTRS will anchor Nuveen's Energy & Power Infrastructure Credit Fund II .
-

The blockchain-based credit network raised $175m, the largest in DeFi to date.
-

The announcement follows an invitation to tender in November 2025.