


By Phil Mackintosh, Chief Economist, Nasdaq

Phil Mackintosh, Nasdaq
In the past we’ve talked theoretically about the costs of routing to inverted vs. maker-taker venues.
Let’s look at some of the studies that quantify the costs of routing, using real data. The results are revealing, and indicate trading economics that are much more efficient than many pundits claim. It also proves that costs can be quantified, if you’re willing to do the math.
How do exchange fees and rebates affect queue economics again?
Rebates are used by many exchanges to reward those providing lit quotes. Although they are a cost for takers, they create market “goods” that includes tighter spreads and deeper, more stable quotes that in turn results in better fills off exchange.
But what other (inverted) venues do instead is charge providers and rebate takers. As Chart 1 shows, even if all venues are quoting on the NBBO, this creates very different spread capture after costs.
Chart 1: Take fees (rebates) and inverted exchanges create a different all-in spread capture
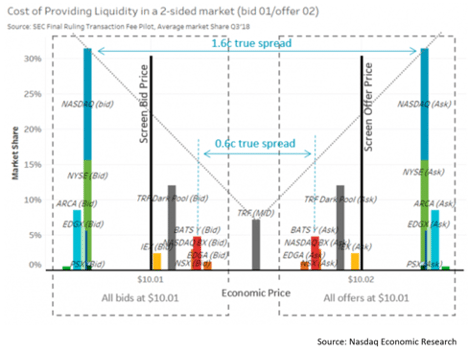
It also results in inverted venues being the most attractive to take from first, as the take rebate reduces the net spread.
Studies by Pragma, Battalio Jennings and others have found that paying for this queue priority results in better execution prices. But as we discuss here, execution prices are missing a lot of the true economics of the trade.
The reason those studies ignore rebates is because they are paid to the broker, not the investors. Essentially the investors get fills “free” of the economics of take fees, which are absorbed by brokers. That highlighted a conflict of interest. In fact, the SEC even proposed an Access Fee Pilot to reduce broker routing conflicts.
However, as many pointed out at the time, the conflict is between the broker and their customer. So eliminating rebates at the exchanges seemed like an inefficient way to solve this conflict. This ignored other market incentives that contribute to dark prices, and the value that lit price incentives provide to those trading off-exchange. These unintended externalities may have cost investors more than they would have saved.
Chart 2: Rebates significantly improve market quality (spreads and depth) in lit markets, and therefore also off-exchange executions
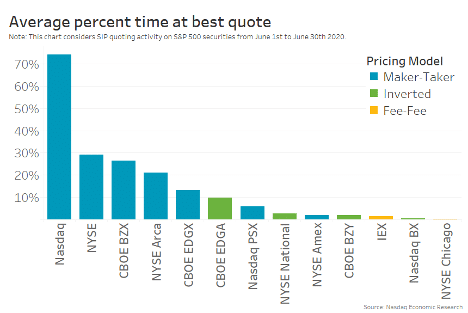
Our research even suggests the deeper queues on maker taker venues alone might offset take costs.
That’s consistent with other studies that showed that when exchange fees change, transaction costs for liquidity demanders remain unaffected once fees are taken into account. That study also found that when posted bid-ask spreads decline, traders, particularly retail traders, use aggressive orders more frequently, and their adverse selection costs decrease.
But what about passive order routes?
A new study of all-in trading costs with real trading data
A recent study using real Dimensional Fund Advisors (DFA) trading data that found that after accounting for more than just the cost of take fees, the “all-in” (or net) trading costs of routing to inverted venues and market taker venues was the same.
The DFA study captures the “cost” of each fill by looking at a 5-minute VWAP markout. That’s a useful way to measure the quality of each venue, as it captures the different levels of adverse selection for the queue priority in different venues, as well as potential longer term momentum (good near touch fills).
In doing this, the DFA study shows a more complete picture of the costs of trading, their “all in” costs include: “All-in costs = take fees – rebates – mid spread captured + Impact (five minute markouts).”
Where negatives are “savings” and positives are “costs.”
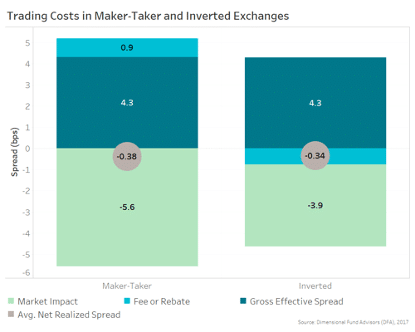
The results are summarized in Chart 3, which shows that after accounting for spreads, exchange fees and rebates, and market impact, net realized spreads (grey circle, all-in trading costs) are essentially the same across venue type.
Specifically, this study finds that “…net of fees and rebates, trading costs are statistically indistinguishable between maker-taker and inverted exchanges. This finding has important implications for venue routing decisions.”
Chart 3: DFA data found net costs are statistically the same comparing inverted to market taker venues
Other studies have shown the same thing
Others, including Bernstein, have also looked at the all-in trading costs of routing on a shorter-term basis. These studies use markouts after the fill rather than the “five-minute VWAP cost” of later trades.
Despite the different approach, what they find is consistent. Even on this shorter-term basis, the markouts are better on inverted exchanges but that is almost exactly offset by the cost differential of making and taking on them.
Chart 4: Bernstein found that the all-in trading costs are consistent across all exchanges
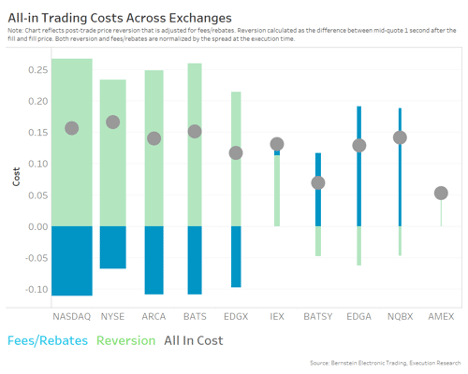
Looking at this data across each exchange shows that large exchanges are very close to equal regardless of fee model.
Chart 4 is sorted by liquidity (bar size and rank is by market share). The fact that all-in trading costs (grey dots) marginally decline as the chart moves to the right is interesting. However, rather than showing higher costs, it may reflect the markets valuation of savings from more liquidity. Essentially there are other costs of waiting in less liquidvenues that are not included here.
That makes sense when you consider how fill probability is especially important for investors who need to trade fast.
What about measuring real opportunity costs?
One thing that these markout approaches don’t capture is the opportunity costs of missing fills on maker taker exchanges and needing to chase a market for a fill.
However a study by Virtu (then KCG) back in 2017 did simulate horse races in real queue data (similar to Battalio’s approach). That captures the actual “cost to complete” vs. the first route prices for each child order. That study also found that even a simple completion strategy had roughly equal all-in (net) trading execution costs.
Although interestingly that study found that for stocks below $25 per share, rebate capture strategies using maker-taker markets had significantly better all-in trading costs than inverted routes. Even though the gross execution prices on inverted venues were much better. That stock-price distortion is caused by the economics of wide ticks and longer queues. It’s part of a wider discussion on trading, and why we’ve been discussing stock splits and were part of an industry group that supported Intelligent Ticks, rather than dynamic round lots, last year.
What does this all mean?
Put simply, if rebates and take fees were passed on to investors, not only would the broker conflict go away, patient traders would likely be indifferent to where they routed. Rebates wouldn’t matter!
That’s another sign of an efficient market price for liquidity (and also why we think a Financial Transaction Tax will have more impact than legislators think).
There are simpler ways to limit this broker-investor conflict. Altering commission rates over time, to include net fees and rebates each algorithm incurs, would also neutralize most of the conflict. And the SEC’s new 606 Rules make those net costs far more transparent. Importantly it would do it without also distorting the current balance of incentives for lit vs. dark quotes like the Access Fee Pilot did.
But there is a bigger takeaway as we charge into NMS II. It’s important to quantify all costs before considering large policy shifts – and there is usually data to do that!
We get it: Math is hard, especially when systems are complex. But what we and others have found is “free” is usually where the inefficiencies begin.
Quantifying the Cost of Maker-Taker Markets was originally published by Nasdaq.

NEWSLETTER SIGN UP
And receive exclusive articles on securities markets
🏆 The 2026 Global Markets Choice Awards are here! 🌍 Nominations are officially OPEN for the celebration of excellence in global capital markets trading & technology. Nominate below:
https://www.jotform.com/form/260086385121150
Delaware Life Insurance Company is becoming the first insurance carrier to offer an index that contains cryptocurrency, adding the BlackRock U.S. Equity Bitcoin Balanced Risk 12% Index to its fixed index annuity (FIA) portfolio.
As the digital assets industry pushes toward
Franklin Templeton is expanding its tokenized fund suite, signaling growing institutional demand for blockchain-based fund infrastructure and regulated investment products moving onchain. Read the full article below:
$50 billion in active ETF inflows helped fuel a record year for @BlackRock 's iShares business, as investors continue to lean into active strategies.
Related articles
-

First quarter net revenues were a record in the largest two businesses.
-

TP ICAP's FCA-registered trading venue transitioned to a matched principal model.
-

BTIG is among the top 10 U.S. brokers for high-touch equity volume executed.
-

The acquisition strengthens TP ICAP’s position in equity derivatives and fixed income.
-

The joint venture with Susquehanna will serve FCM platforms with derivatives, including prediction markets.