


One well known market adage is to “sell in May and go away.” The way market volumes typically fall during the summer makes it look like many investors often do follow that advice.
This year, however, is different.
Volume and VIX are elevated

Phil Mackintosh, Nasdaq
Instead, trading volumes have remained elevated, even as volatility returns to more normal levels.
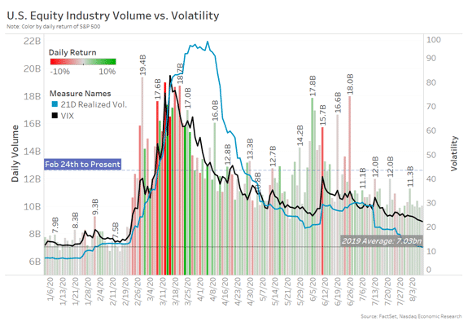
Looking back, volatility data shows that market uncertainty spiked in the middle of March 2020, just as the U.S. economy saw widespread quarantine shutdowns. We also saw four Market-Wide Circuit Breakers, thousands of single stock halts, and stocks with short sell restrictions. The emergency Fed and fiscal responses also added trillions of dollars to the economy, offsetting the gap between GDP and personal income, caused by hundreds of thousands of shuttering businesses.
The scale of daily returns increased (the more intense colors in in Chart 1) and trading volumes increased too (the height of those bars). These factors caused realized volatility to increase (blue line). It also caused a spike in VIX, which measures expected volatility from S&P 500 options 30 days away (black line).
Interestingly, U.S. market volume peaked even earlier, on February 28, as traders reacted to news the pandemic raged around other parts of the world, but two months before America’s deadliest days in May.
Chart 1: Volumes and VIX remain elevated, even as returns and realized volatility returned to normal
Lately it feels like markets are moving mostly sideways, tracking up, but very gradually.
Data shows that’s true. Actual daily returns and realized volatility have fallen all the way back to pre-Covid levels (blue line and the fading of the colors in the bars).
If we take a closer look, all is not as calm as it seems. Despite the reduction in realized (actual) volatility, and the onset of the summer months, trading activity and the VIX (expected volatility, black line) remain stubbornly elevated. Average daily volumes are still around 40% above last year’s levels and consistently over 10 billion shares per day. The VIX remains above 20, now almost double the level of realized volatility.
All this tells us the U.S. market is still quite uncertain about the future. That’s because news on new Covid spikes, vaccines, inflation and unemployment, as well as the upcoming U.S. presidential election, all add to significant valuation uncertainty in stocks and bonds.
Lately low realized volatility seems to indicate the market may have become somewhat numb to these incremental news bites. Although it’s more likely recent news just isn’t as significant as news on a vaccine (or not) will be.
Daily trading has changed
There are other important changes in trading activity too.
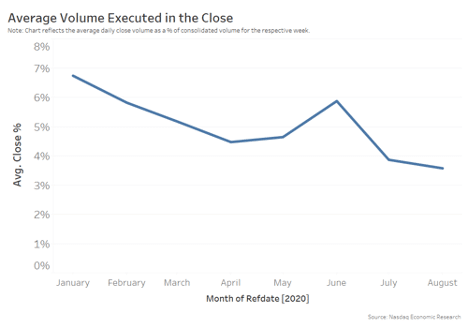
The closing auction is usually a popular time to trade. Not only does it minimize tracking error on cash flows and index rebalances, it also represents a large source of cheap liquidity.
However, since March, a larger proportion of trading has moved earlier in the day (Chart 2).
That speaks, in part, to more trader working orders with more urgency. Worried more about news, momentum and opportunity costs than liquidity costs. That makes sense with stocks reacting more predictably to high-impact news on vaccines or stimulus.
Chart 2: Volumes have shifted to earlier in the day as traders seek to avoid opportunity costs
Retail trading is more active
One of the other big shifts in the market this year is the increase in retail trading.
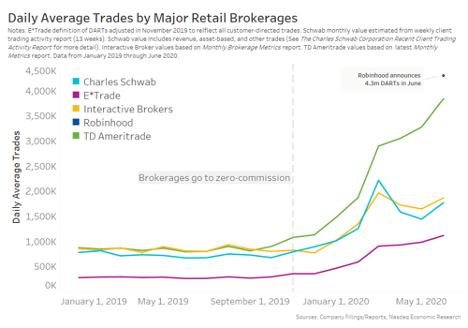
According to data from retail brokers, trading by their customers has more than doubled. Although this trend started when “commission free” trading was introduced last year, it has accelerated since the Covid quarantine began and has not returned to pre-Covid levels, even as more people return to work.
Chart 3: Daily average trades from retail brokerages
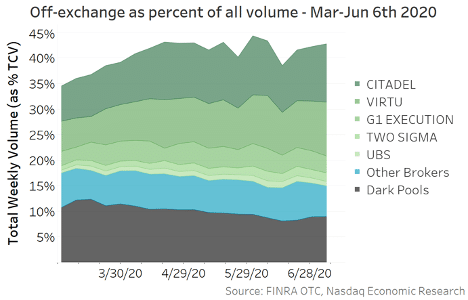
Some experts have said recently that retail trading could be add up to 25% of trades made on the busiest days. This is supported by data from FINRA showing non-ATS TRF trades (off exchange trades not done by dark pools) have grown to around 36% of all volume as of this past July 6. We can break those trades down by broker to see that a high proportion are from wholesalers who serve as a market maker to retail orders (green in Chart 4). Adding dark pools, which mutual fund traders use, raises recent off-exchange volume to 43% of all trading.
Using this data, we estimate that retail accounts for around 3.8 billion shares each day, an increase of 1 billion shares per day on pre-Covid levels. Even still, that’s only one-third of the market-wide increase in trading.
Chart 4: Wholesalers have seen their off exchange trading increase by a factor or 42% to now be 36% of all trading
Retail are trading small cap stocks
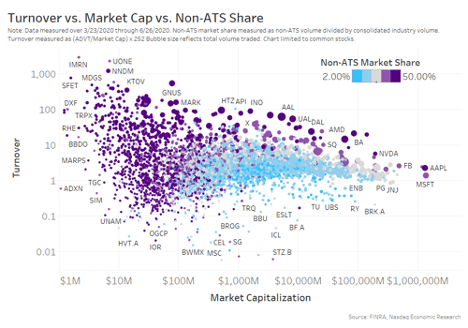
Data shows that retail trading is focused mostly in small cap and high profile large cap stocks (see purple dots on left side of Chart 4). In addition, stocks with high retail interest also seem to have much higher liquidity (market cap turnover per year).
Another way to interpret this data is that it shows that a majority of small cap liquidity is inaccessible for institutions. Although some high profile large cap stocks like AAPL, MSFT, AMZN, and FB have similarly high proportions of off exchange trading.
Chart 5: Over 800 stocks have more than 50% of their trading off exchange
An interesting twist on the data debate
This all comes at an interesting time for U.S. equity market structure. The SEC’s policy to focus on exchange rebates and data revenues have continued. But at the very same time, off-exchange trading, which is benchmarked to those same prices, is growing.
In addition, new Rule 606 reporting shines a light on the value of incentives for trading in the market. If we annualize Q1-20 Payment For Order Flow (PFOF) revenue, it adds up to more than $1.8 billion a year. That’s before including price improvement and profits from wholesaling.
That’s already nearing the total value of rebates paid by exchanges to all investors who trade on exchange. It’s also many multiples of SIP and depth data costs combined, for all traders, on trades that aren’t hitting exchanges.
It makes you wonder: Are we taking for granted just how much good the public prices add?

NEWSLETTER SIGN UP
And receive exclusive articles on securities markets
It's been a month since we had our Women In Finance Awards in New York City at the Plaza! Take a look back tab some moments, and nominate for our upcoming awards in Mexico City and Singapore here: https://www.marketsmedia.com/category/events/
4Citadel Securities told the SEC that trading tokenized equities should remain under existing market rules, a position that drew responses from various crypto industry groups. @ShannyBasar for @MarketsMedia:
SEC Commissioner Mark Uyeda argued that private assets belong in retirement plans, saying diversified alts can improve risk-adjusted returns and that the answer to optimal exposure “is not zero.” @ShannyBasar reporting for @MarketsMedia:
COO of the Year Award winner! 🏆
Discover how Jennifer Kaiser of Marex earned the 2025 Women in Finance COO of the Year recognition.
Related articles
-

These are real, regulated public shares: issued onchain and recorded directly on the issuer’s cap table.
-

The regulator founf stronger practices compared to its 2014 thematic review.
-

Public companies can raise capital by offering tokenized shares with settlement in stablecoins.
-

The offer consists entirely of secondary shares to be sold by certain selling stockholders.
-

The architecture coordinates liquidity across all partner chains and complements existing market structures.