


- The gross market value of over-the-counter (OTC) derivatives, which provides a measure of amounts at risk, rose from $11.6 trillion to $15.5 trillion during the first half of 2020, led by increases in interest rate derivatives.
- Similarly, gross credit exposure, which adjusts market values for legally enforceable netting agreements, jumped from $2.4 trillion at end-2019 to $3.2 trillion at end-June 2020, the largest rise since 2009.
- Central clearing rates of credit default swaps rose from 56% at end-2019 to 60% at end-June 2020, the largest increase since H1 2017.
The gross market value of OTC derivatives increased by 33% in the first half of 2020; gross credit exposure saw the largest rise since 2009, while the notional amount remained relatively stable #OTCderivatives #derivatives #BISStatistics https://t.co/hNQI2vpHWG pic.twitter.com/8frt8vpn3S
— Bank for International Settlements (@BIS_org) November 9, 2020
Gross market value of OTC derivatives surges in H1 2020
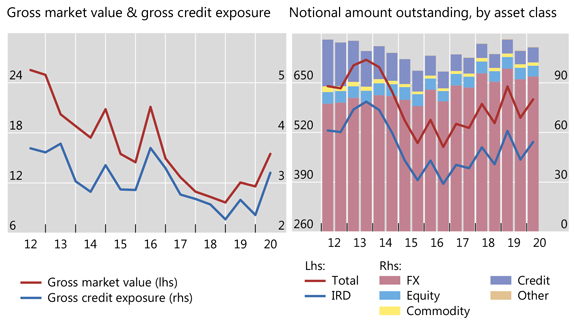
Graph 1: Outstanding OTC derivatives, USD trillions (interactive graph).
Source: BIS OTC derivatives statistics (Table D5.1 and D5.2).
The Covid-19-induced market turmoil and strong policy responses drove developments in derivatives markets in the first half of 2020. The gross market value of derivative contracts – summing positive and negative values – surged from $11.6 trillion at end-2019 to $15.5 trillion at end-June 2020, a 33% increase within six months (Graph 1, left-hand panel). Similarly, gross credit exposure – which adjusts gross market values for legally enforceable bilateral netting agreements (but not for collateral) – also saw a large increase in the first half of 2020, from $2.4 trillion at end-2019 to $3.2 trillion at end-June 2020. This was the largest rise since 2009.
These sharp movements stand in contrast to the relative stability of notional amounts of derivative contracts in the first half of 2020, broadly in line with the trend observed in recent years. Notional amounts of all OTC derivatives combined increased to $607 trillion at end-June 2020, only 9% above end-December 2019 (Graph 1, right-hand panel). The increase primarily reflected interest rate derivatives, whose notional amounts increased from $449 trillion at end-2019 to $495 trillion at end-June 2020, mainly attributable to a seasonal pattern.1 The notional amounts of other contracts remained relatively flat over the same period.
Interest rate derivatives drive rise in gross market value
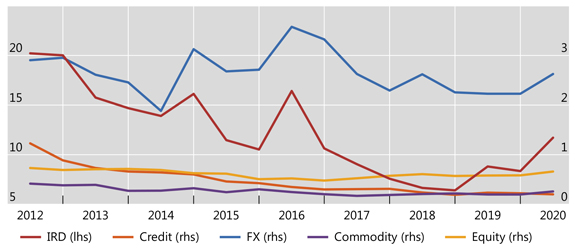
Graph 2: Gross market value of OTC derivatives, USD trillions (interactive graph).
Source: BIS OTC derivatives statistics (Table D5.1 and D5.2).
Interest rate derivatives saw the largest increase in gross market value (40%), led by USD-denominated contracts (Graph 2, red line). In particular, USD-denominated contracts jumped by 86% to $3 trillion (Graph 3, red line), the largest increase since the Great Financial Crisis (GFC) of 2007-09. For their part, the gross market value of EUR-denominated contracts also rose by 26%, standing at $5 trillion at end-June 2020 (Graph 3, blue line).
Following the Covid-induced market turmoil in March 2020, many central banks cut rates and took other measures to support economic activity.2 The outlook for USD-denominated interest rate contracts, in particular, changed more substantially than that for contracts in other currencies.3 Unanticipated changes generated the gap between market interest rates on the reporting date and rates prevailing at contract inception, thus boosting the reported gross market value.4
The gross market value of other types of derivatives also rose in the first half of 2020, reflecting large price movements and elevated market volatility.5 The gross market value of commodity contracts increased by 32% to stand at $260 billion at end-June 2020 (Graph 2, purple line). At 18% and 13% respectively, the increase for both OTC foreign exchange contracts and equity-linked contracts was somewhat smaller but still significant, pushing market values to $2.6 trillion and $0.7 trillion respectively at end-June 2020 (blue and yellow lines). By contrast, the market value of credit derivatives decreased by 10% to $199 billion at end-June 2020 (orange line).
USD interest rate contracts see the largest increase in market value
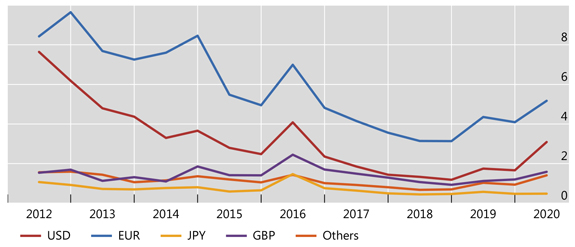
Graph 3: Gross market value of OTC interest rate derivatives, USD trillions (interactive graph). “Other” refers to contracts denominated in currencies other than USD, EUR, JPY and GBP.
Source: BIS OTC derivatives statistics (Table D7).
Central clearing rates trend upwards, especially for CDS
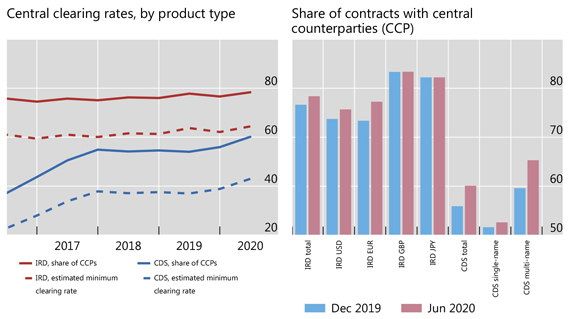
Graph 4: Percentage of notional amounts outstanding of OTC interest rate derivatives (IRD) and credit default swaps (CDS) cleared by central counterparties (CCP). Estimated minimum clearing rate is the proportion of trades that are cleared, calculated as (CCP / 2) / (1 – (CCP / 2)), where CCP represents the share of notional amounts outstanding that dealers report against CCPs. The CCP share is halved to adjust for the potential double-counting of interdealer trades novated to CCPs.
Source: BIS OTC derivatives statistics (Table D5.1 and D10.1).
Having plateaued in recent years, central clearing rates, particularly for credit default swaps (CDS), picked up again in H1 2020. The share of CDS contracts (notional amount outstanding) cleared by central counterparties (CCPs) increased from 56% at end-2019 to 60% at end-June 2020 (Graph 4, left-hand panel, blue solid line; and Annex Graph A8). This was the largest increase since H1 2017, when clearing rates had trended upwards following the 2009 G20 commitment to clear standardised OTC derivative contracts.
The recent increase in central clearing of CDS mainly stemmed from multi-name CDS. The share cleared by CCPs increased from 60% to 65% of total notional outstanding in the first half of 2020 (Graph 4, right-hand panel). The clearing rate for single-name CDS rose in parallel, but more modestly, from 52% to 53%.
The central clearing rate for interest rate derivatives remained nearly constant, up from 77% to 78% in H1 2020 (red solid line). Most of the increase was for EUR- and USD-denominated contracts. More than 77% and 75% of EUR- and USD-denominated interest rate contracts were cleared by CCPs at end-June 2020, up from 73% and 74% at end-2019, respectively.
Source: BIS

NEWSLETTER SIGN UP
And receive exclusive articles on securities markets
🏆 The 2026 Global Markets Choice Awards are here! 🌍 Nominations are officially OPEN for the celebration of excellence in global capital markets trading & technology. Nominate below:
https://www.jotform.com/form/260086385121150
Delaware Life Insurance Company is becoming the first insurance carrier to offer an index that contains cryptocurrency, adding the BlackRock U.S. Equity Bitcoin Balanced Risk 12% Index to its fixed index annuity (FIA) portfolio.
As the digital assets industry pushes toward
Franklin Templeton is expanding its tokenized fund suite, signaling growing institutional demand for blockchain-based fund infrastructure and regulated investment products moving onchain. Read the full article below:
$50 billion in active ETF inflows helped fuel a record year for @BlackRock 's iShares business, as investors continue to lean into active strategies.
Related articles
-

Moving collateral takes only minutes, compared to hours or even days.
-

This deepens the integration of Chinese assets into the international financial infrastructure.
-

Fragmentation in EU cash equities clearing creates unnecessary costs.
-

The move marks a major expansion of Citi's precious metals business.
-

OTC Clear will be able to settle RMB funds directly via the Cross-Border Interbank Payment System.