


By Phil Mackintosh, Chief Economist, Nasdaq
The Nasdaq-100 is a very different index than the S&P500. It is technology dominant, excludes financials by design, and is historically underweight in many of the old economy stocks in the energy and industrials sectors.
That exposure to new economy stocks has helped it to outperform the broad market by 347% over the past 10 years ended Q3 2020, while also avoiding the worst of the past two crises. As a consequence, more and more portfolios are tracking the Nasdaq indexes. But historically, hedges and income strategies have been imperfect, thanks to the fact that the most common volatility hedges were on the S&P500 via the Cboe Volatility Index: VIX.
Today we talk about the new Nasdaq-100 Volatility Index: VOLQ®, why it’s different, and why it should better describe expectations for future Nasdaq volatility. For a start, it’s based on Nasdaq-100 index options, in contrast to CBOE’s VIX indicator, which uses S&P 500 index options.
Volatility 101
First, it is important to understand some different volatility terms and how volatility indicators work. Let’s start with the difference between realized (historic) and implied (expected) volatility:
- Realized volatility is the historic volatility we’ve seen in the market in the past. It’s calculated using the standard deviation of actual returns.
- Implied volatility measures the markets’ expected volatility in the future. They do that using options prices on future expiry dates, as we explain below.
Buying an option is a little bit like buying car insurance. You don’t know if you will use (exercise) it, and it may just expire and be worthless. Intuitively, the price of the insurance (or option) should equal the value of expected claims. When Black-Scholes created their options pricing formula to do this, they realized an option would be worth more (more likely to be exercised) if it has specific characteristics, such as:
- Closer to in-the-money: meaning the stock price was already at or near the price where the option would make a payoff.
- Further from expiry: a longer time increases the chance that the underlying stock price will get to an in-the-money price.
- On a more volatile underlying stock: as the potential for a large price move increases, the chance the stock moves to an in-the-money price.
To understand “moneyness,” let’s look at the following example: if you hold a call option contract with a strike price of $100 per share and the underlying stock price is greater than $100, you have the right to purchase the stock at a discount to the current market price (in-the-money, ITM). On the other hand, if the underlying stock is less than $100, your contract is “out-of-the-money (OTM)” because your contract gives you the right to buy the stock at a higher price than the current market price.
Chart 1: “Moneyness” depends on the underlying stock price and strike price

Then, the fact that the price of an option includes information about the expected volatility of the underlying stock or index is how volatility indicators are produced.
Thanks to the Black-Scholes formula, the expected volatility can be reverse engineered once you have all the other known inputs to the Black-Scholes formula. In fact, it’s so easy to do that many options are “quoted” in volatility points, rather than cents, as that allows investors to compare whether the expected volatility for each stock (or index) is the richer or cheaper.
Implied volatility varies across “moneyness”
However, one of the things many investors might not realize is that the expected volatility for any single underlying asset (stock or index) is NOT the same, even for options expiring on the same date.
The reason is a mathematical quirk tied to the fact that Black-Scholes assumes returns are log-normal, when in fact, they are not. In real life, the chance of a big price move is higher than the statistical model predicts. That would lead to a more profitable exercise than the model predicts for “tail” events. Rather than “fix” the distribution (which is, of course, different because of specific event risks for each underlying asset), markets instead simply charge more than the pricing model suggests for those options.
In the industry, it’s called skew and can be seen by the U-shape of implied volatilities as you move further from at-the-money.
Chart 2: VIX includes all out-of-the-money options, including lots of skew

Chart 2 shows real skew in Nasdaq options prices from September 2020. What is important to note is that as you move away from “at-the-money,” the implied volatility:
- Changes significantly.
- The difference in expected volatility of puts and calls for the same exercise prices starts to vary more too.
- Trading of those contracts is also far lower, which may mean those volatilities are less accurately priced. Chart 3 shows that most Nasdaq options volume is clustered around 11,000, the “at-the-money” price of the Nasdaq-100 when the data were pulled.
Chart 3: Most liquidity trades closer to at-the-money and in short-dated contracts
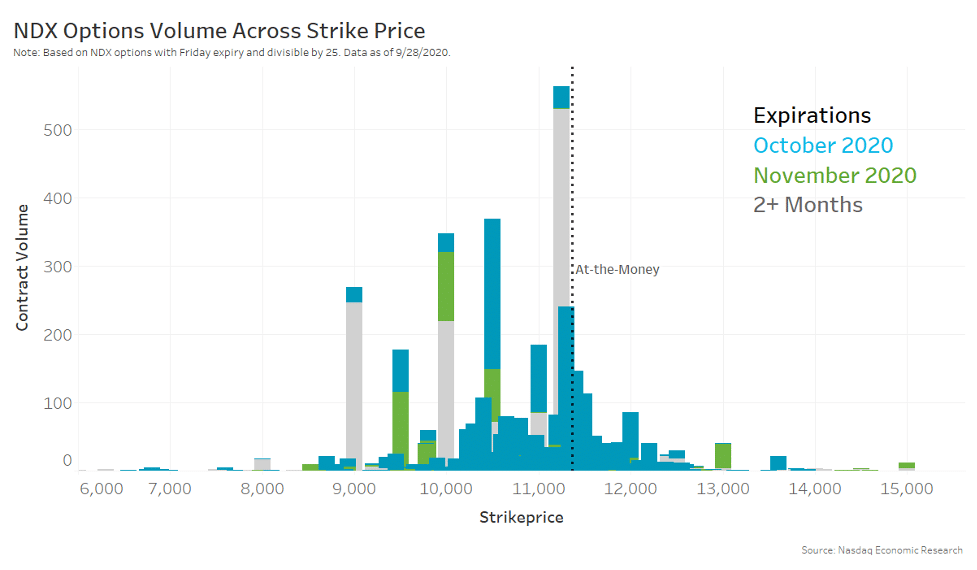
So, the at-the-money contracts are not only the most active (in terms of notional traded), but they also have puts and calls with closest to the same volatility for each strike, unlike skew puts and calls.
Which raises the important question: Which expected volatility is the right expected volatility for indicators to use?
Chart 4: VOLQ focuses on at-the-money (ATM) options contracts, disregarding deep out-of-the-money (OTM) options skew
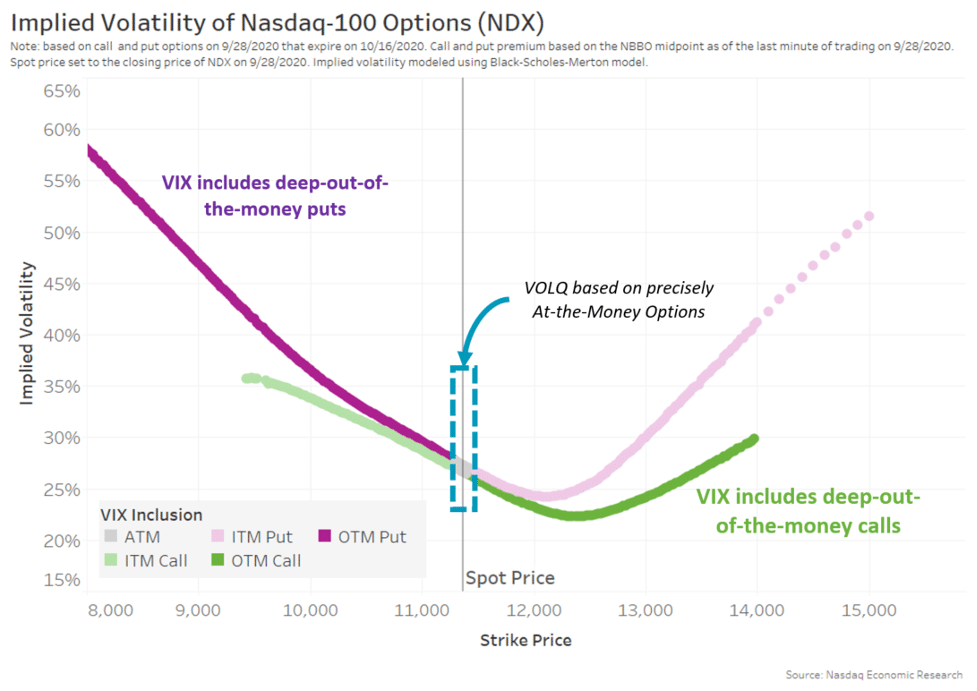
VIX includes skew from less liquid deep out-of-the-money options
The best-known volatility indicator, the VIX, is based on a large portfolio of out-of-the-money calls and puts. Basically, it includes the range of option prices that we show in dark purple and green in Chart 4. That avoids the problem with the spread between put and calls at the same strike.
VIX also creates an “effective 30-day forward” volatility by computing a pro-rata volatility from some expiries shorter than 30 days and others that are longer than 30 days. That avoids most of the term structure problem, where longer volatility is usually higher.
But it does include a lot of skew. It also includes prices from less liquid options contracts.
VOLQ is a new index that eliminates skew on less liquid OTM options
Nasdaq created a new index (VOLQ) based on Nasdaq-100 index options. Importantly, it has a different design that fix for both the skew and less liquid deep out-of-the-money (OTM) pricing problems. It answers the question traders ask throughout every trading day, “Where is at-the-money volatility?”
VOLQ still creates an “effective 30-day forward” volatility by computing a pro-rata volatility from some expiries shorter than 30 days and others that are longer than 30 days. To do this, VOLQ uses four consecutive weekly contracts (i.e., four “terms”) with Friday expirations that range anywhere from 16 days to 43 days from the current date to extrapolate implied volatility for 30 days.
But, it adds a concept of “precisely-at-the-money” options by first creating a forward index price that represents the expected Nasdaq-100 future index price based on market-determined put/call parity. Second, VOLQ chooses puts and calls from two 25-point strikes above and below the forward price, thereby eliminating the skew problem and excluding less liquid OTM options from the calculation.
This means that VOLQ also includes put and call prices that are both ITM and OTM, but only those that are closest to ATM. Overall, VOLQ utilizes 32 distinct contracts to come up with an estimate of annualized implied volatility.
It then pro-rata weights those contracts so that the implied volatility represents a strike price exactly equal to the spot index with 30 days until expiry.
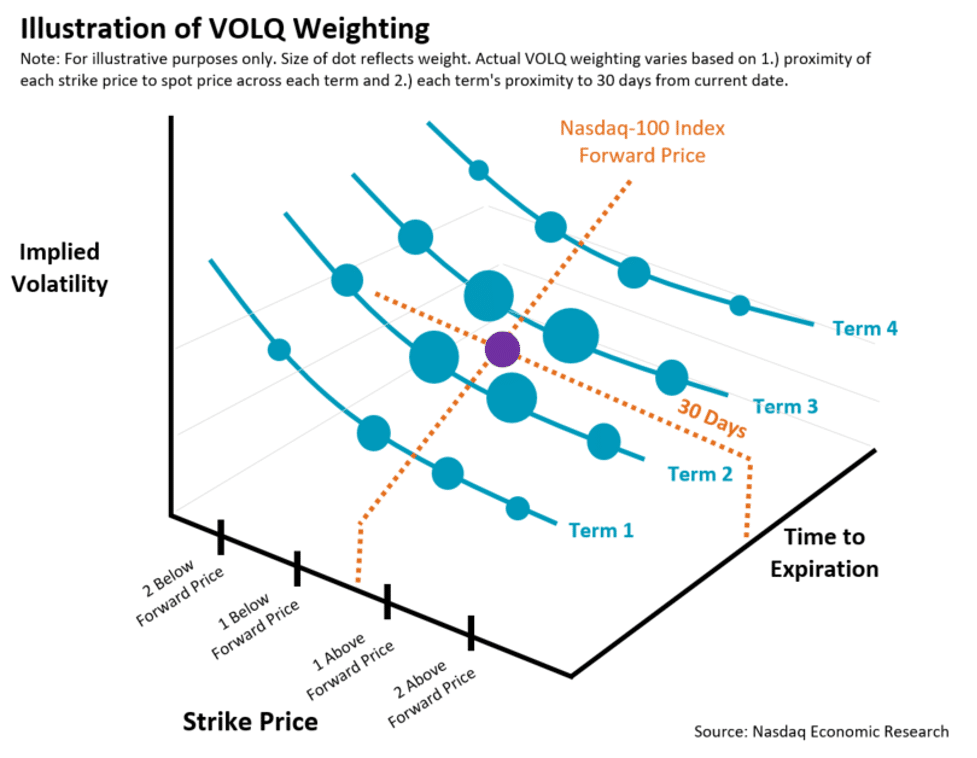
If you’re interested, full details on the math are here. But the way it works is shown visually in Chart 5:
- Puts and calls from two 25-point strikes each side of the forward Nasdaq-100 index price are used (blue dots), excluding the rest of the volatility “surface.”
- Weekly expiries from two weeks each side of 30 days are used (blue lines).
- The contracts closer to the precisely at the money virtual option (purple dot) are more heavily weighted too.
Chart 5: How VOLQ gets a “precisely at-the-money” implied volatility
VOLQ is the superior way to measure volatility on the Nasdaq-100
All these changes make VOLQ a better volatility indicator for the market.
Table 1: Comparing VOLQ to VIX
| Volatility from options on |
Options trade on | Future on | Excludes Skew | Liquid contracts | Puts and Calls |
30 day forward volatility |
|
| VOLQ | Nasdaq-100 Index |
PHLX, ISE, GEMX |
CME | YES | YES | YES (all near ATM) | YES |
| VIX | S&P500 Index | Cboe | Cboe Futures Exchange | NO(OTM contracts) | NO | YES*(ATM & 1-side OTM) | YES |
It’s also a much better hedge for investors owning a portfolio of Nasdaq stocks.
VOLQ: How to Measure Nasdaq-100 Volatility was originally published by Nasdaq.

NEWSLETTER SIGN UP
And receive exclusive articles on securities markets
🏆 The 2026 Global Markets Choice Awards are here! 🌍 Nominations are officially OPEN for the celebration of excellence in global capital markets trading & technology. Nominate below:
https://www.jotform.com/form/260086385121150
Delaware Life Insurance Company is becoming the first insurance carrier to offer an index that contains cryptocurrency, adding the BlackRock U.S. Equity Bitcoin Balanced Risk 12% Index to its fixed index annuity (FIA) portfolio.
As the digital assets industry pushes toward
Franklin Templeton is expanding its tokenized fund suite, signaling growing institutional demand for blockchain-based fund infrastructure and regulated investment products moving onchain. Read the full article below:
$50 billion in active ETF inflows helped fuel a record year for @BlackRock 's iShares business, as investors continue to lean into active strategies.
Related articles
-

They aim to build a bridge between Japan's capital markets and the global tokenized economy.
-

Perpetual futures can offer price discovery of the ADR premium for U.S. shares of a foreign stock.
-

Nicolas Rivard, global head of cash equity and data services, discusses the strategic plan for 2027.
-

There is accelerating adoption of Tradeweb AiEX, as clients continue to embed automation.
-

The underlying securities are held in the same infrastructure that custodies U.S. securities today.